
NHL Advanced Stats for Betting: xG, Corsi and What Actually Predicts Wins
 Available in US

Why Traditional Stats Mislead NHL Bettors
For my first three years of NHL betting, I used the same stats everyone else did: goals for, goals against, power play percentage, save percentage. They seemed sufficient — they are the numbers on every broadcast, every post-game recap, every pub conversation about hockey. Then I started losing to the market consistently, and I could not figure out why. The answer was that traditional stats describe what happened. Advanced stats describe what should have happened, and the gap between those two is where the betting market lives.
Goals are noisy. A team can dominate possession, generate thirty high-quality scoring chances, hit three posts, and lose 1-0 on a fluky deflection. Traditional stats record that as a loss with a single goal against — the exact same result as a team that was outplayed and survived on goaltending. Advanced metrics strip away the noise and expose the underlying process. When a team’s process is strong but their results are lagging, the market tends to overprice their opponents. When a team’s results are hot but the process is weak, a correction is coming. That correction is your edge.
Expected Goals (xG): the Premier Metric
Expected goals, or xG, assigns a probability to every shot based on its location, angle, shot type, and the game situation (even strength, power play, shorthanded). A shot from the slot directly in front of the net might carry an xG of 0.15, meaning it scores roughly 15% of the time. A shot from the blue line carries an xG of 0.02 or less. By summing every shot’s xG across a game or a season, you get a picture of how many goals a team should have scored or conceded, independent of whether the puck actually went in.
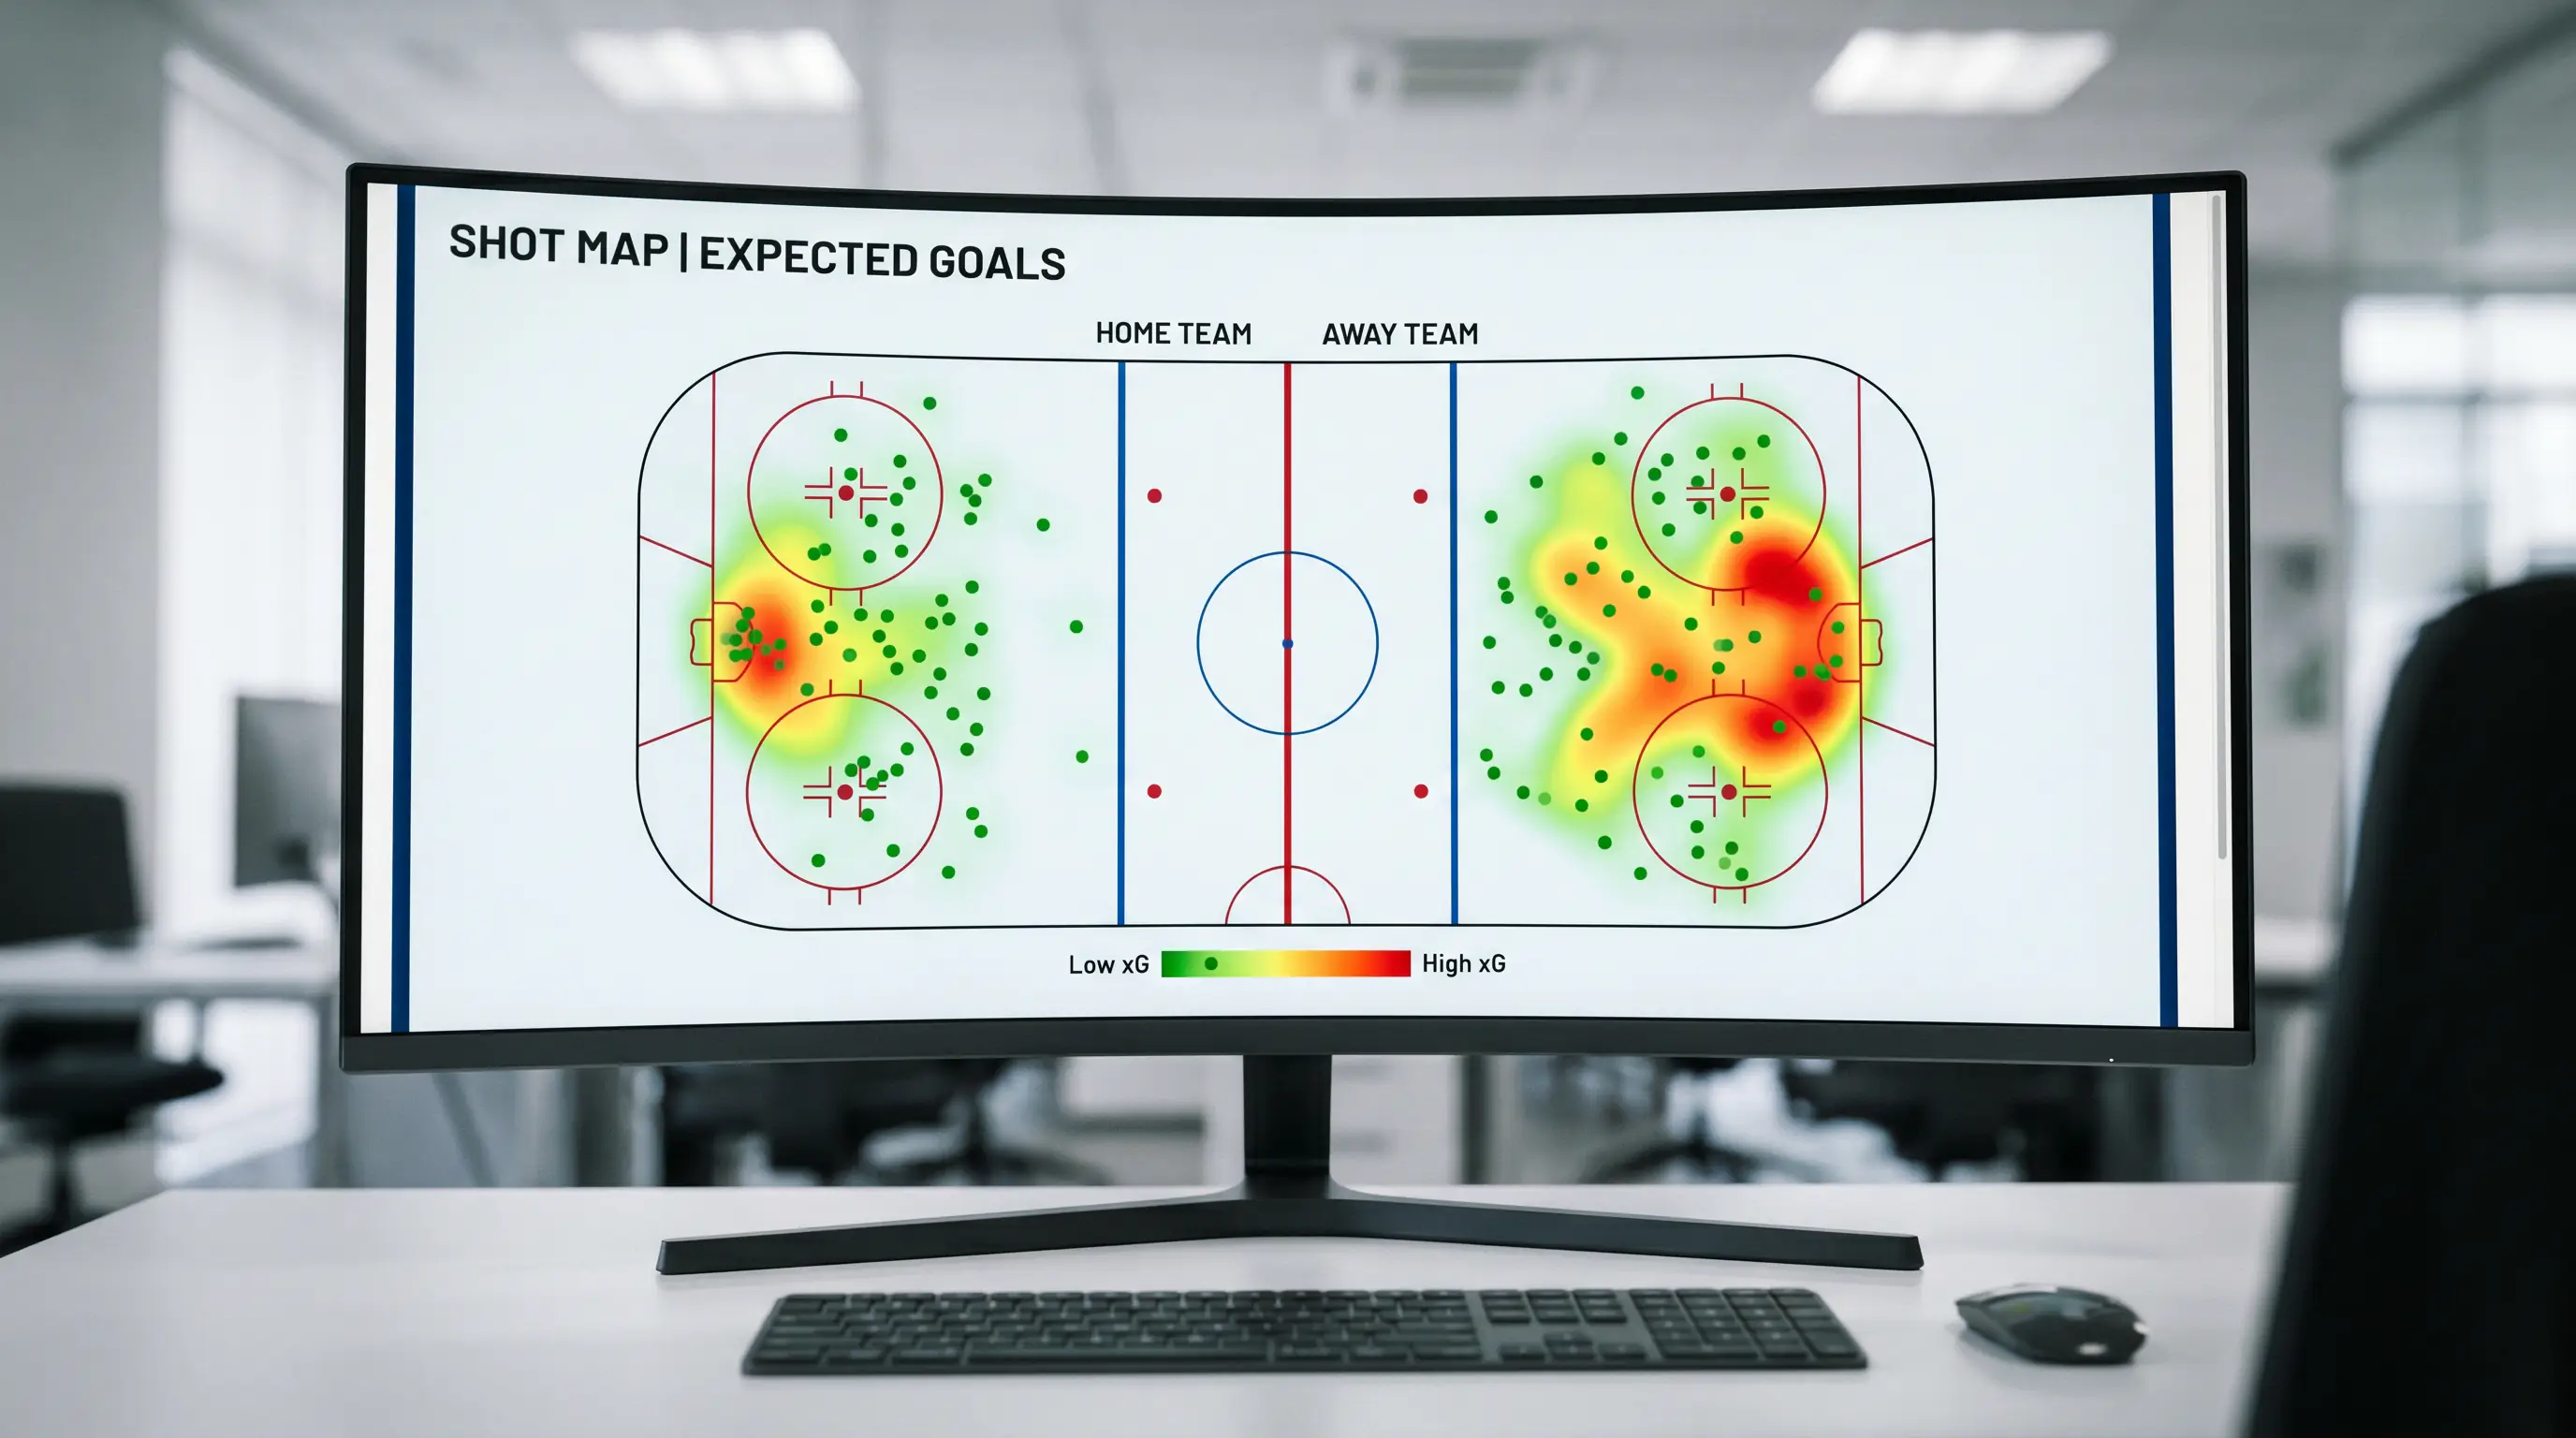
The power of xG lies in its predictive quality. A team that consistently generates more xG than they concede — even if the scoreboard does not always reflect it — is playing a style that wins over time. Bookmakers use xG models internally, but their lines must also accommodate public money, which follows the scoreboard rather than the process. When a team is underperforming their xG — scoring fewer goals than the model expects — their moneyline tends to be longer than it should be. That gap between public perception and underlying quality is where I have found the most repeatable edges.

Free xG data is available from sites like Natural Stat Trick and MoneyPuck. Both provide team-level and player-level xG numbers updated daily, and both are free to access. You do not need a paid subscription to start incorporating xG into your betting workflow.
Corsi and Fenwick: Measuring Puck Possession
Before xG became widely available, Corsi was the advanced metric that changed hockey analytics. Named after former NHL goaltending coach Jim Corsi, the stat counts all shot attempts at even strength — goals, saves, misses, and blocked shots. A team with a Corsi-for percentage (CF%) above 50% is generating more shot attempts than they allow, which is a proxy for controlling possession.
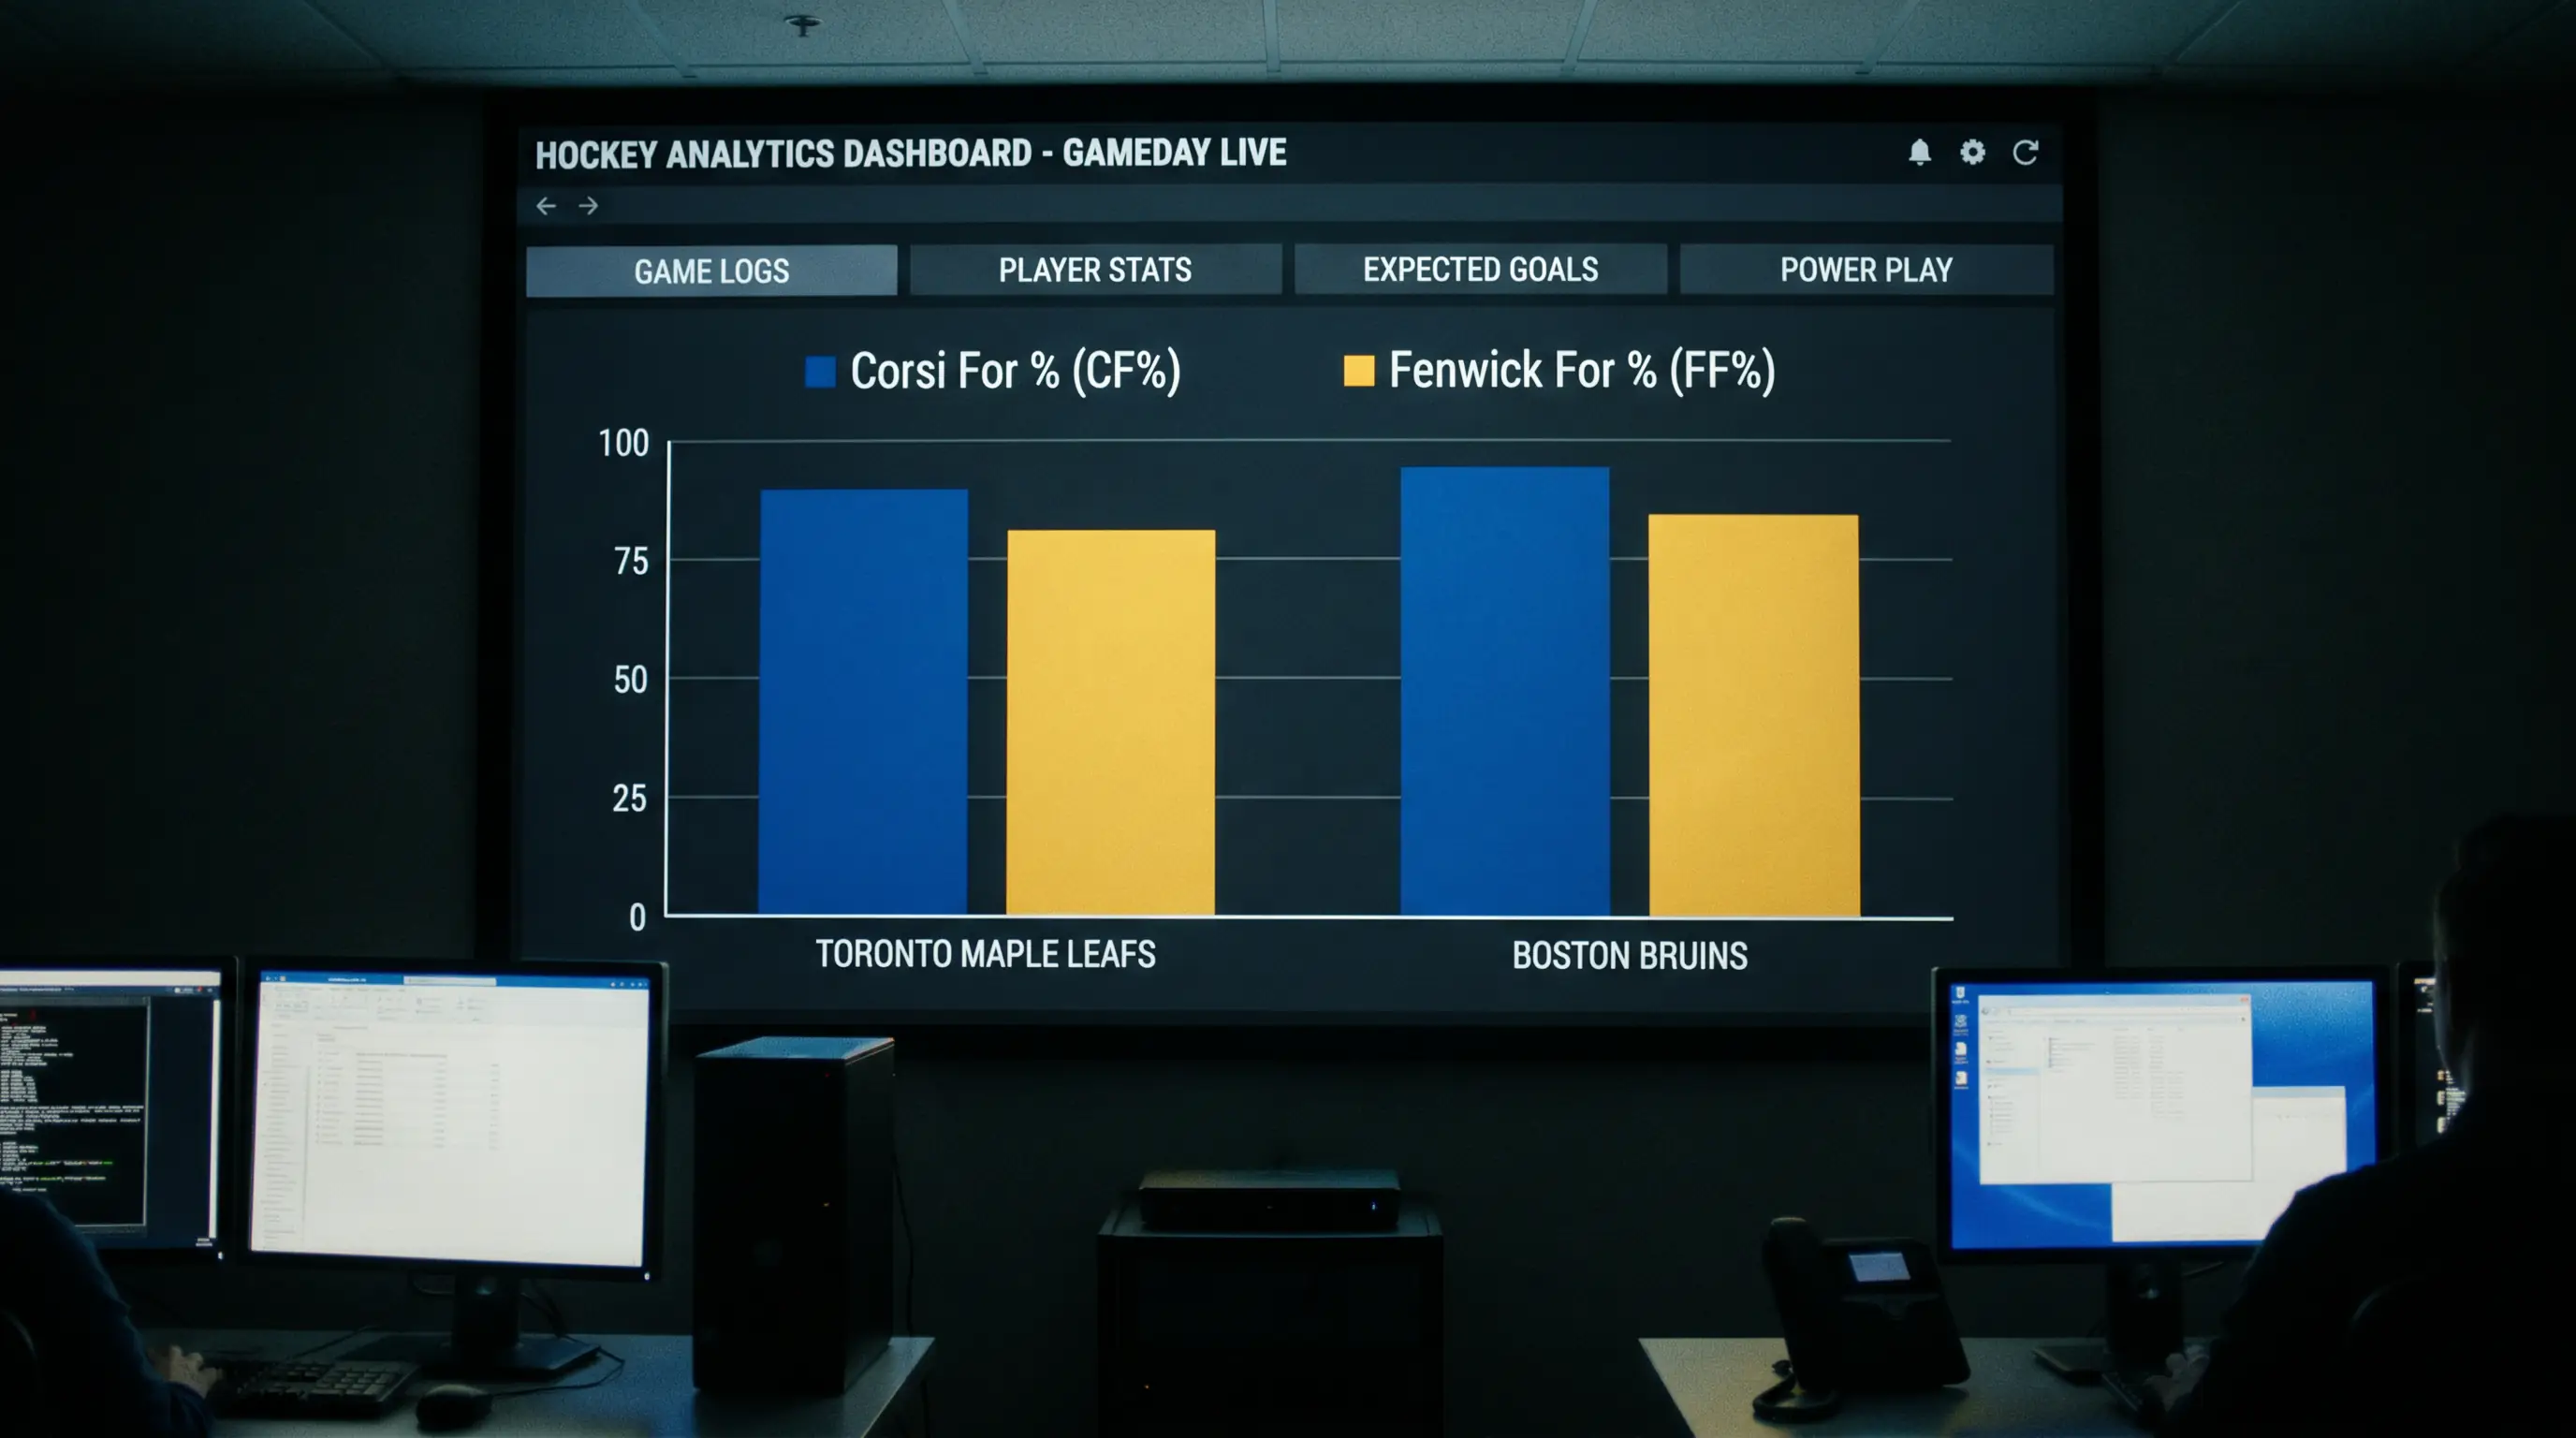
Fenwick refines Corsi by removing blocked shots from the equation. The logic is that blocked shots may reflect a team’s shot-blocking strategy rather than the opponent’s offensive dominance, so excluding them gives a cleaner measure of shot generation. In practice, Corsi and Fenwick track closely together, and most bettors use whichever their preferred data source provides.
Neither metric is perfect on its own. A team can generate a high CF% by firing low-danger shots from the perimeter, inflating the number without creating genuine scoring threats. This is why xG eventually surpassed Corsi as the primary analytical tool — it weights shot quality, not just volume. But Corsi still has value as a complementary indicator. A team with both a high CF% and a high xG% is controlling the puck and creating quality chances, which is the strongest possible process signal.
The combination matters for betting because it filters out false positives. A team with a 53% CF% but a 48% xG% is generating volume without quality — a process that looks good on the surface but underperforms in practice. Conversely, a team with a 48% CF% but a 52% xG% is efficient rather than dominant, getting more from fewer chances. The market tends to price the high-volume team as stronger, creating an opening for bettors who dig into the quality layer.
High-Danger Chances and Power Play Efficiency
High-danger scoring chances — shots from the inner slot, the crease, or the area directly in front of the goaltender — are the subset of xG that carries the most weight. A team that generates 12 high-danger chances per game is creating opportunities that convert at rates above 15%, while a team generating only 7 is relying on lower-probability shots from distance. The high-danger gap between two teams in a matchup is one of the strongest predictors of which side covers the moneyline.

Power play efficiency layers on top. NHL underdogs won 39.1% of games in 2024/25, and a significant portion of those upsets came from underdogs who converted on the power play at critical moments. A team does not need to dominate five-on-five play to win a hockey game — two power play goals can overcome a five-on-five disadvantage entirely. When I assess a matchup, I look at the power play conversion rate and the penalty-kill percentage for both teams, then cross-reference with the referee crew’s historical penalty-calling rate. Some crews call tight games with six or seven penalties, which inflates the importance of special teams. Others let play flow, reducing the special-teams variable.
Translating Advanced Stats into Betting Decisions
A Tech Insider review of NHL betting strategy summarised it well: NHL betting rewards patience and process more than star-gazing. Advanced stats are the process. The question is how to translate them into actionable wagers.

My workflow starts with a screening filter. I pull each team’s rolling ten-game xG differential, CF%, and high-danger chance percentage. Teams whose xG differential is positive but whose recent results are negative — say, they have lost four of the last six despite outshooting and out-chancing their opponents — go onto a watch list. Their moneylines are likely inflated by the recent losses, even though the process says they are playing winning hockey.
Next, I check individual matchup data. Some teams match up poorly against specific styles — a possession-heavy team might struggle against a counterattacking opponent that concedes shot volume but limits quality. Head-to-head xG numbers, available on MoneyPuck, reveal these stylistic mismatches that season-long averages cannot capture.
Finally, I compare my assessment to the market price. If the moneyline implies a 45% win probability but my model — built on xG, CF%, and matchup data — suggests 52%, I have a bet. If the gap is smaller than five percentage points, I pass, because the margin of error in my model is not tight enough to justify action on thin edges. This disciplined approach to closing line value ensures that I am betting on genuine statistical gaps rather than gut feelings dressed up in numbers.
What advanced stats matter for NHL betting?
Expected goals (xG) is the most predictive single metric, measuring shot quality rather than just volume. Corsi and Fenwick track shot-attempt volume as a proxy for possession. High-danger scoring chances isolate the most valuable offensive opportunities. For a complete picture, combine xG differential with high-danger chance rates and power play efficiency to identify teams whose underlying process is stronger or weaker than their results suggest.
Where can I find free NHL xG data?
Natural Stat Trick and MoneyPuck are the two most popular free sources for NHL advanced statistics, including xG, Corsi, Fenwick, and high-danger chance data at both team and player level. Both sites update daily during the season and provide historical data for trend analysis. No paid subscription is required for the core metrics most bettors use.
Prepared by the NHL Hockey Bets editorial staff.