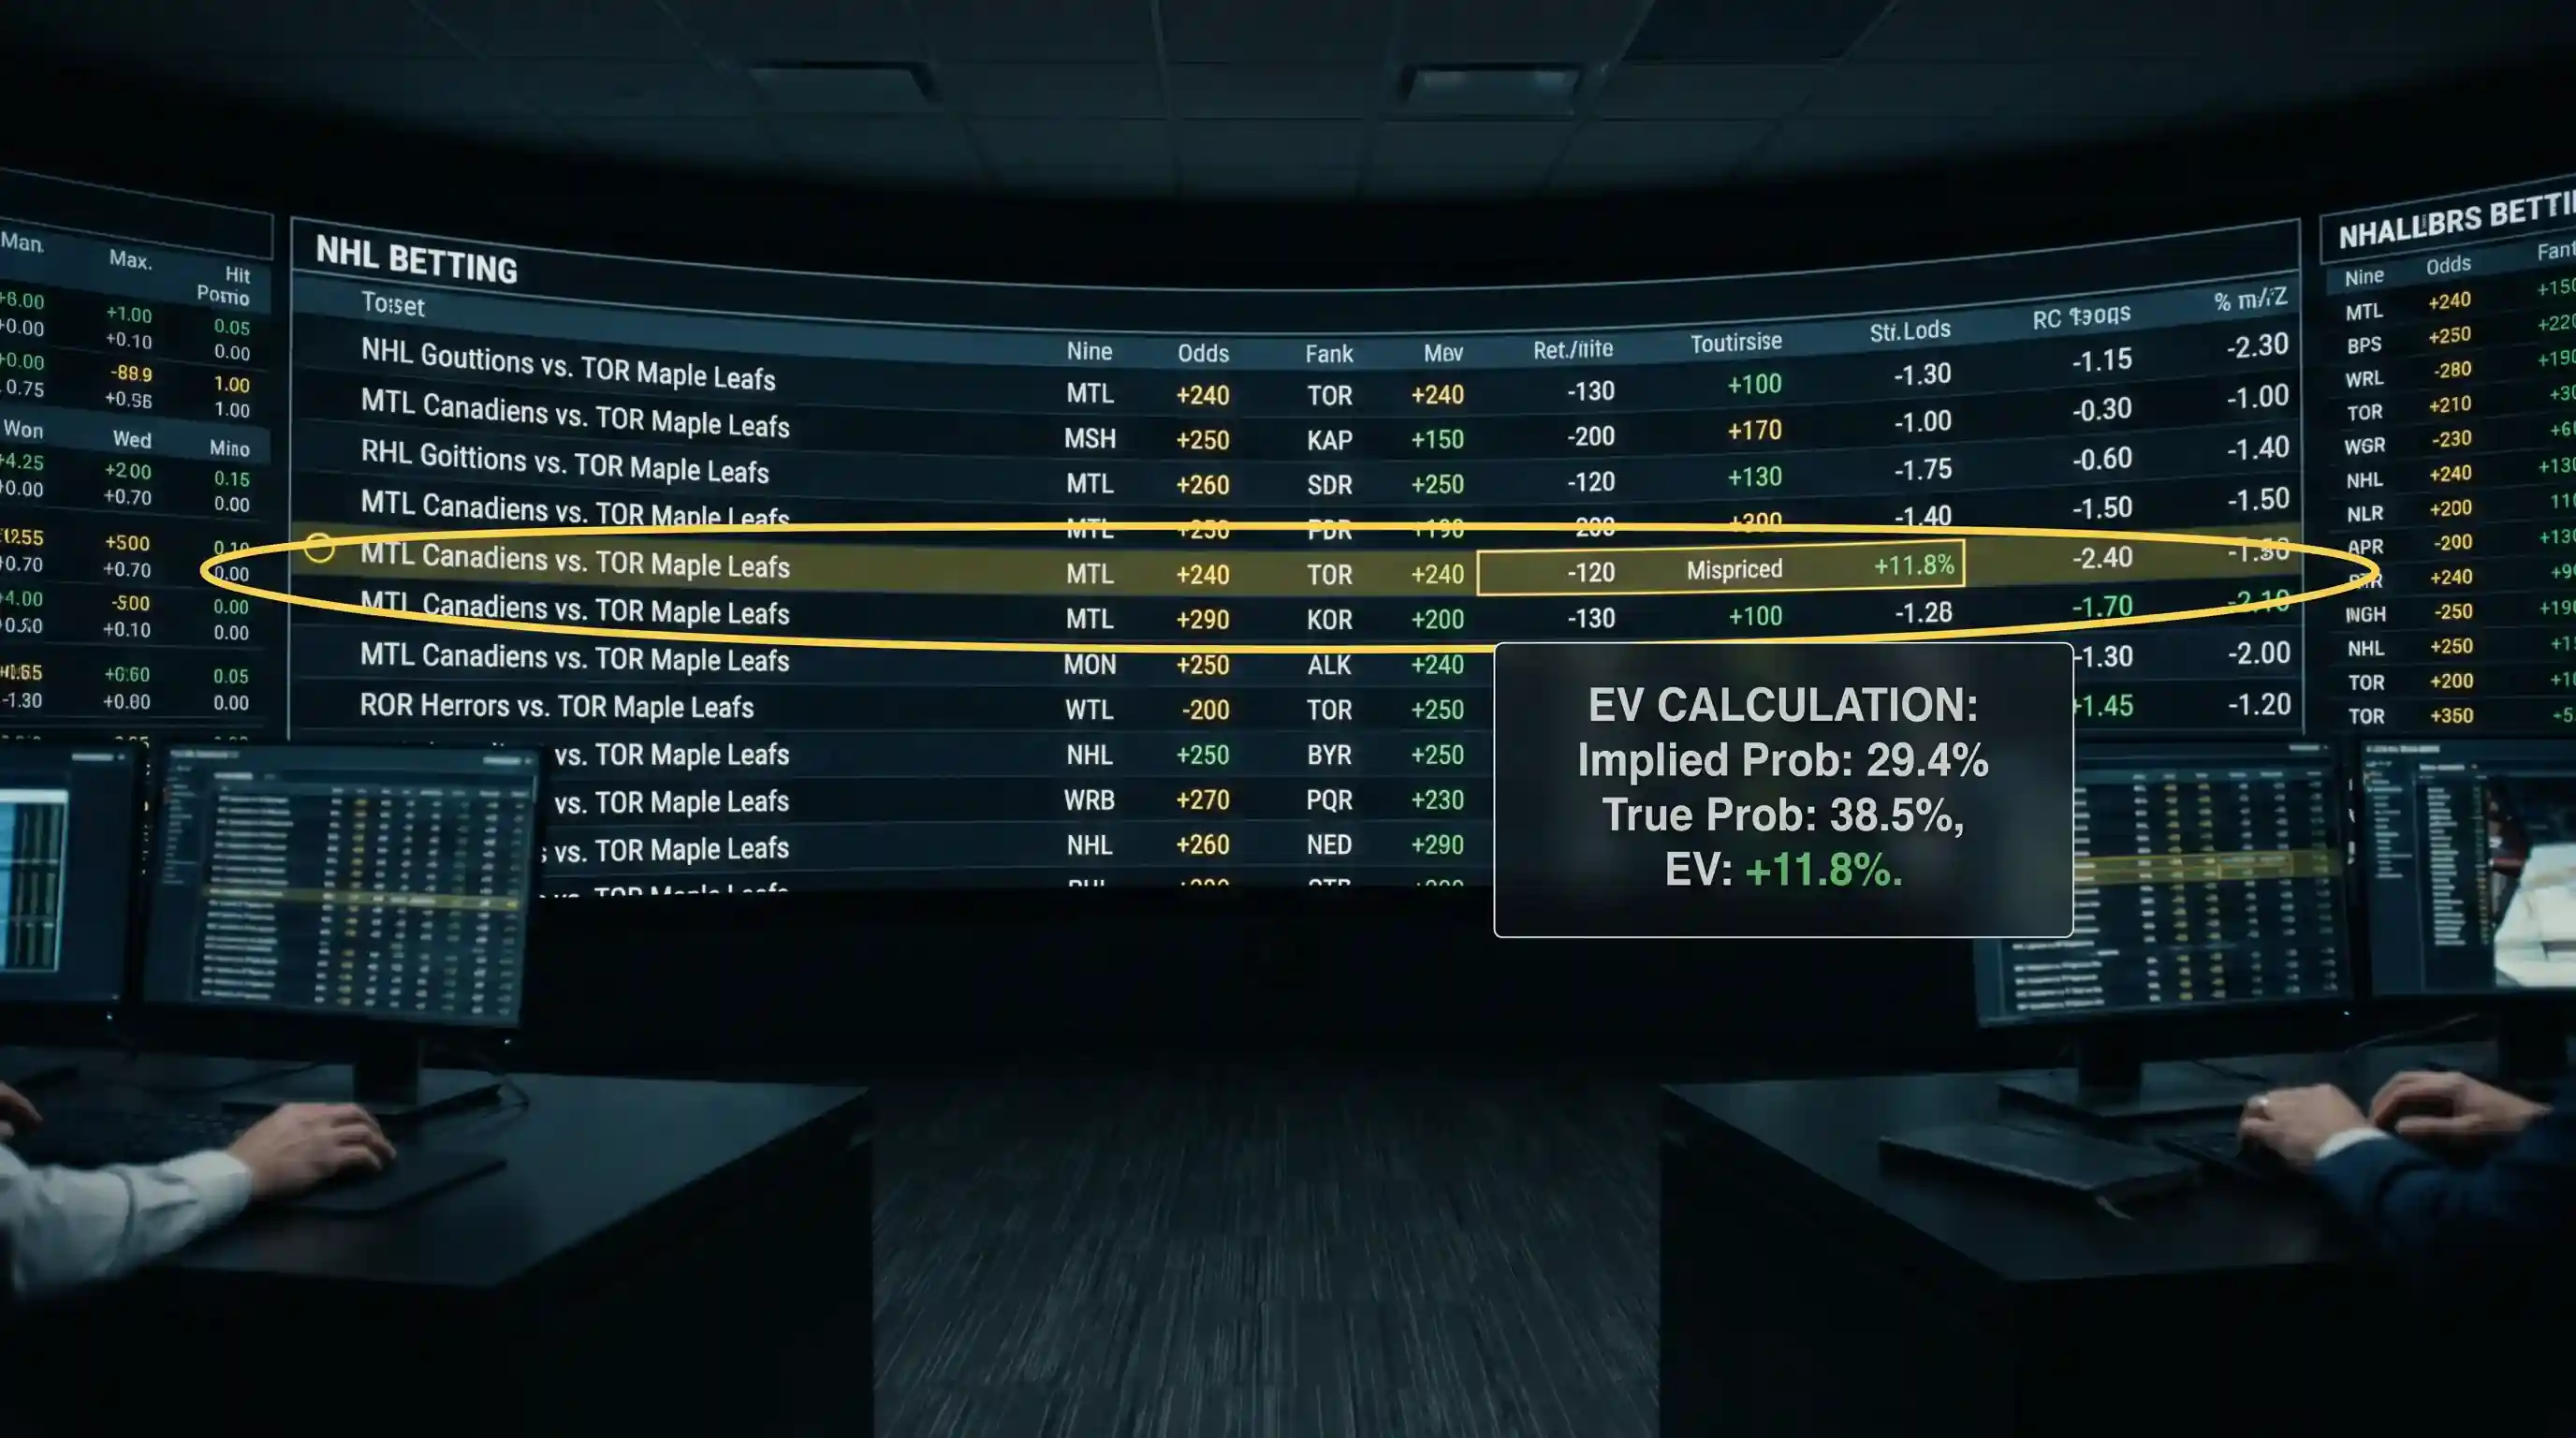
NHL Betting Odds Explained: How to Read, Compare and Beat Them
 Available in US

Table of Contents
- What NHL Odds Tell You — and What They Hide
- Decimal, Fractional and American: Reading Every Format
- Converting Odds to Implied Probability
- How Bookmaker Margins Shape NHL Odds
- Why NHL Odds Move: Goalies, Injuries and Money
- Comparing Odds Across UK Bookmakers
- NHL Odds vs Football Odds: What UK Bettors Should Expect
- NHL Betting Odds FAQ
What NHL Odds Tell You — and What They Hide
I remember my first NHL bet as a UK punter. The odds said 1.83 on one side and 2.10 on the other. I picked the bigger number because “higher pays more.” I won that bet by accident and learned absolutely nothing. It took a full season of inconsistent results before I realised that odds are not just prices — they are compressed arguments about probability, and every bookmaker bakes a hidden fee into them.
NHL odds in the UK sit within a margin band of roughly 4% to 6% on standard moneyline markets. That margin — sometimes called the overround or the vig — is the bookmaker’s cut. It means the prices you see never reflect the true probability of either team winning. They reflect the true probability minus the operator’s profit margin, spread across both sides. Understanding that gap is the difference between treating odds as gospel and treating them as a starting point for your own analysis.
This guide breaks down every aspect of NHL odds for UK punters: how to read the three major formats, how to convert them into implied probabilities, how the bookmaker’s margin distorts them, what causes them to move and how to compare prices across operators to claw back some of that hidden cost. Every example uses pounds sterling and decimal odds, with fractional and American formats explained for context. By the end, you will read an NHL odds board the way a trader reads a stock ticker — not just seeing the number, but understanding the story behind it.
Decimal, Fractional and American: Reading Every Format
Walk into a UK betting shop and you will see fractional odds. Open an online sportsbook and you will likely see decimal. Visit an American hockey forum and everything is in moneyline format with plus and minus signs. All three describe the same thing — the relationship between your stake and your potential return — but they express it differently enough to confuse anyone who has not spent time with each.
Decimal odds are the simplest to work with and the default on most UK online platforms for NHL markets. The number represents your total return per pound staked, including the stake itself. If you place £10 at odds of 2.10, your total return is £10 multiplied by 2.10, which gives you £21.00 — that is your original £10 stake plus £11.00 in profit. A price of 1.50 on £10 returns £15.00 total, meaning £5.00 profit. The maths is always the same: stake times odds equals total payout.

Fractional odds are the traditional British format. They show profit relative to stake. Odds of 11/10 mean you profit £11 for every £10 wagered — equivalent to decimal 2.10. Odds of 1/2 mean you profit £5 for every £10, which is decimal 1.50. To convert fractional to decimal, divide the first number by the second and add one: 11 divided by 10 equals 1.1, plus 1 equals 2.10. Fractional odds appear less frequently in NHL markets online, but they still show up on older UK platforms and in retail shops.
American odds — also called moneyline odds in the US — use a baseline of 100. A positive number like +110 tells you the profit on a $100 stake: bet $100, profit $110. A negative number like -150 tells you how much you need to stake to profit $100: bet $150 to win $100. For UK punters who encounter American odds while reading US-based NHL analysis or line trackers, the conversion to decimal is straightforward. For positive odds, divide by 100 and add 1: +110 becomes 2.10. For negative odds, divide 100 by the absolute value and add 1: -150 becomes 1.67.
In practice, I keep my sportsbook accounts set to decimal. It makes quick comparisons between operators effortless and removes any mental arithmetic when scanning an NHL card with a dozen games. But knowing all three formats is essential if you read any US-sourced analysis — and for NHL betting, some of the sharpest data comes from American platforms where moneyline format is the default.
Converting Odds to Implied Probability
Here is where odds stop being just prices and start becoming tools. Every set of odds encodes an implied probability — the likelihood the bookmaker’s price suggests for that outcome occurring. Once you can extract that number, you can compare it to your own assessment and spot where the market disagrees with you. That disagreement is where bets are born.
The formula for decimal odds is clean: implied probability equals 1 divided by the decimal odds, multiplied by 100 to get a percentage. At odds of 2.10, the implied probability is 1 divided by 2.10, which gives 47.6%. At 1.75, it is 57.1%. At 3.50, it is 28.6%. You do not need a calculator for this once you have run through it a few times — the pattern becomes intuitive. Shorter odds mean higher implied probability; longer odds mean lower.

Now the catch. If you convert both sides of an NHL moneyline to implied probabilities and add them together, the total will exceed 100%. In a perfectly fair market the two sides would sum to exactly 100, but bookmakers add their margin on top. A typical NHL moneyline might price one team at 1.83 (54.6%) and the other at 2.05 (48.8%). Add those together: 103.4%. That extra 3.4 percentage points is the overround — the bookmaker’s built-in profit. The real probabilities of the two outcomes sum to 100%, but the prices imply 103.4%, so the operator wins the difference no matter what happens.
For you as a bettor, the exercise is to strip out the margin and estimate the “true” implied probability. The simplest method is to normalise: divide each side’s implied probability by the total. In the example above, the favourite’s normalised probability is 54.6 divided by 103.4, which gives 52.8%. The underdog’s is 48.8 divided by 103.4, giving 47.2%. Those normalised numbers are your best approximation of what the market genuinely believes about each team’s chances, with the margin removed.
I run this conversion for every NHL game I consider betting on. It takes thirty seconds and reveals whether the posted price offers genuine value or whether the margin has swallowed any edge you thought you had. Without this step, you are flying blind.
How Bookmaker Margins Shape NHL Odds
I spent my first two years of NHL betting completely ignoring margins. I thought I was getting fair prices because the odds “looked right.” Then I started tracking my results against closing lines and realised I was haemorrhaging value on every ticket — not because my picks were bad, but because I was consistently accepting worse prices than I needed to.
The margin on NHL moneylines in the UK averages between 4% and 6%. That range sounds small until you multiply it across a season of bets. On a £10 stake at a 5% margin, you are effectively paying 50p per bet in hidden cost. Over 200 bets in a season, that is £100 gone before you win or lose a single game on merit. Fixed-odds betting remains the dominant format in the global market — accounting for about 28% of all sports wagering — so this margin structure is baked into the product most punters use without thinking twice.
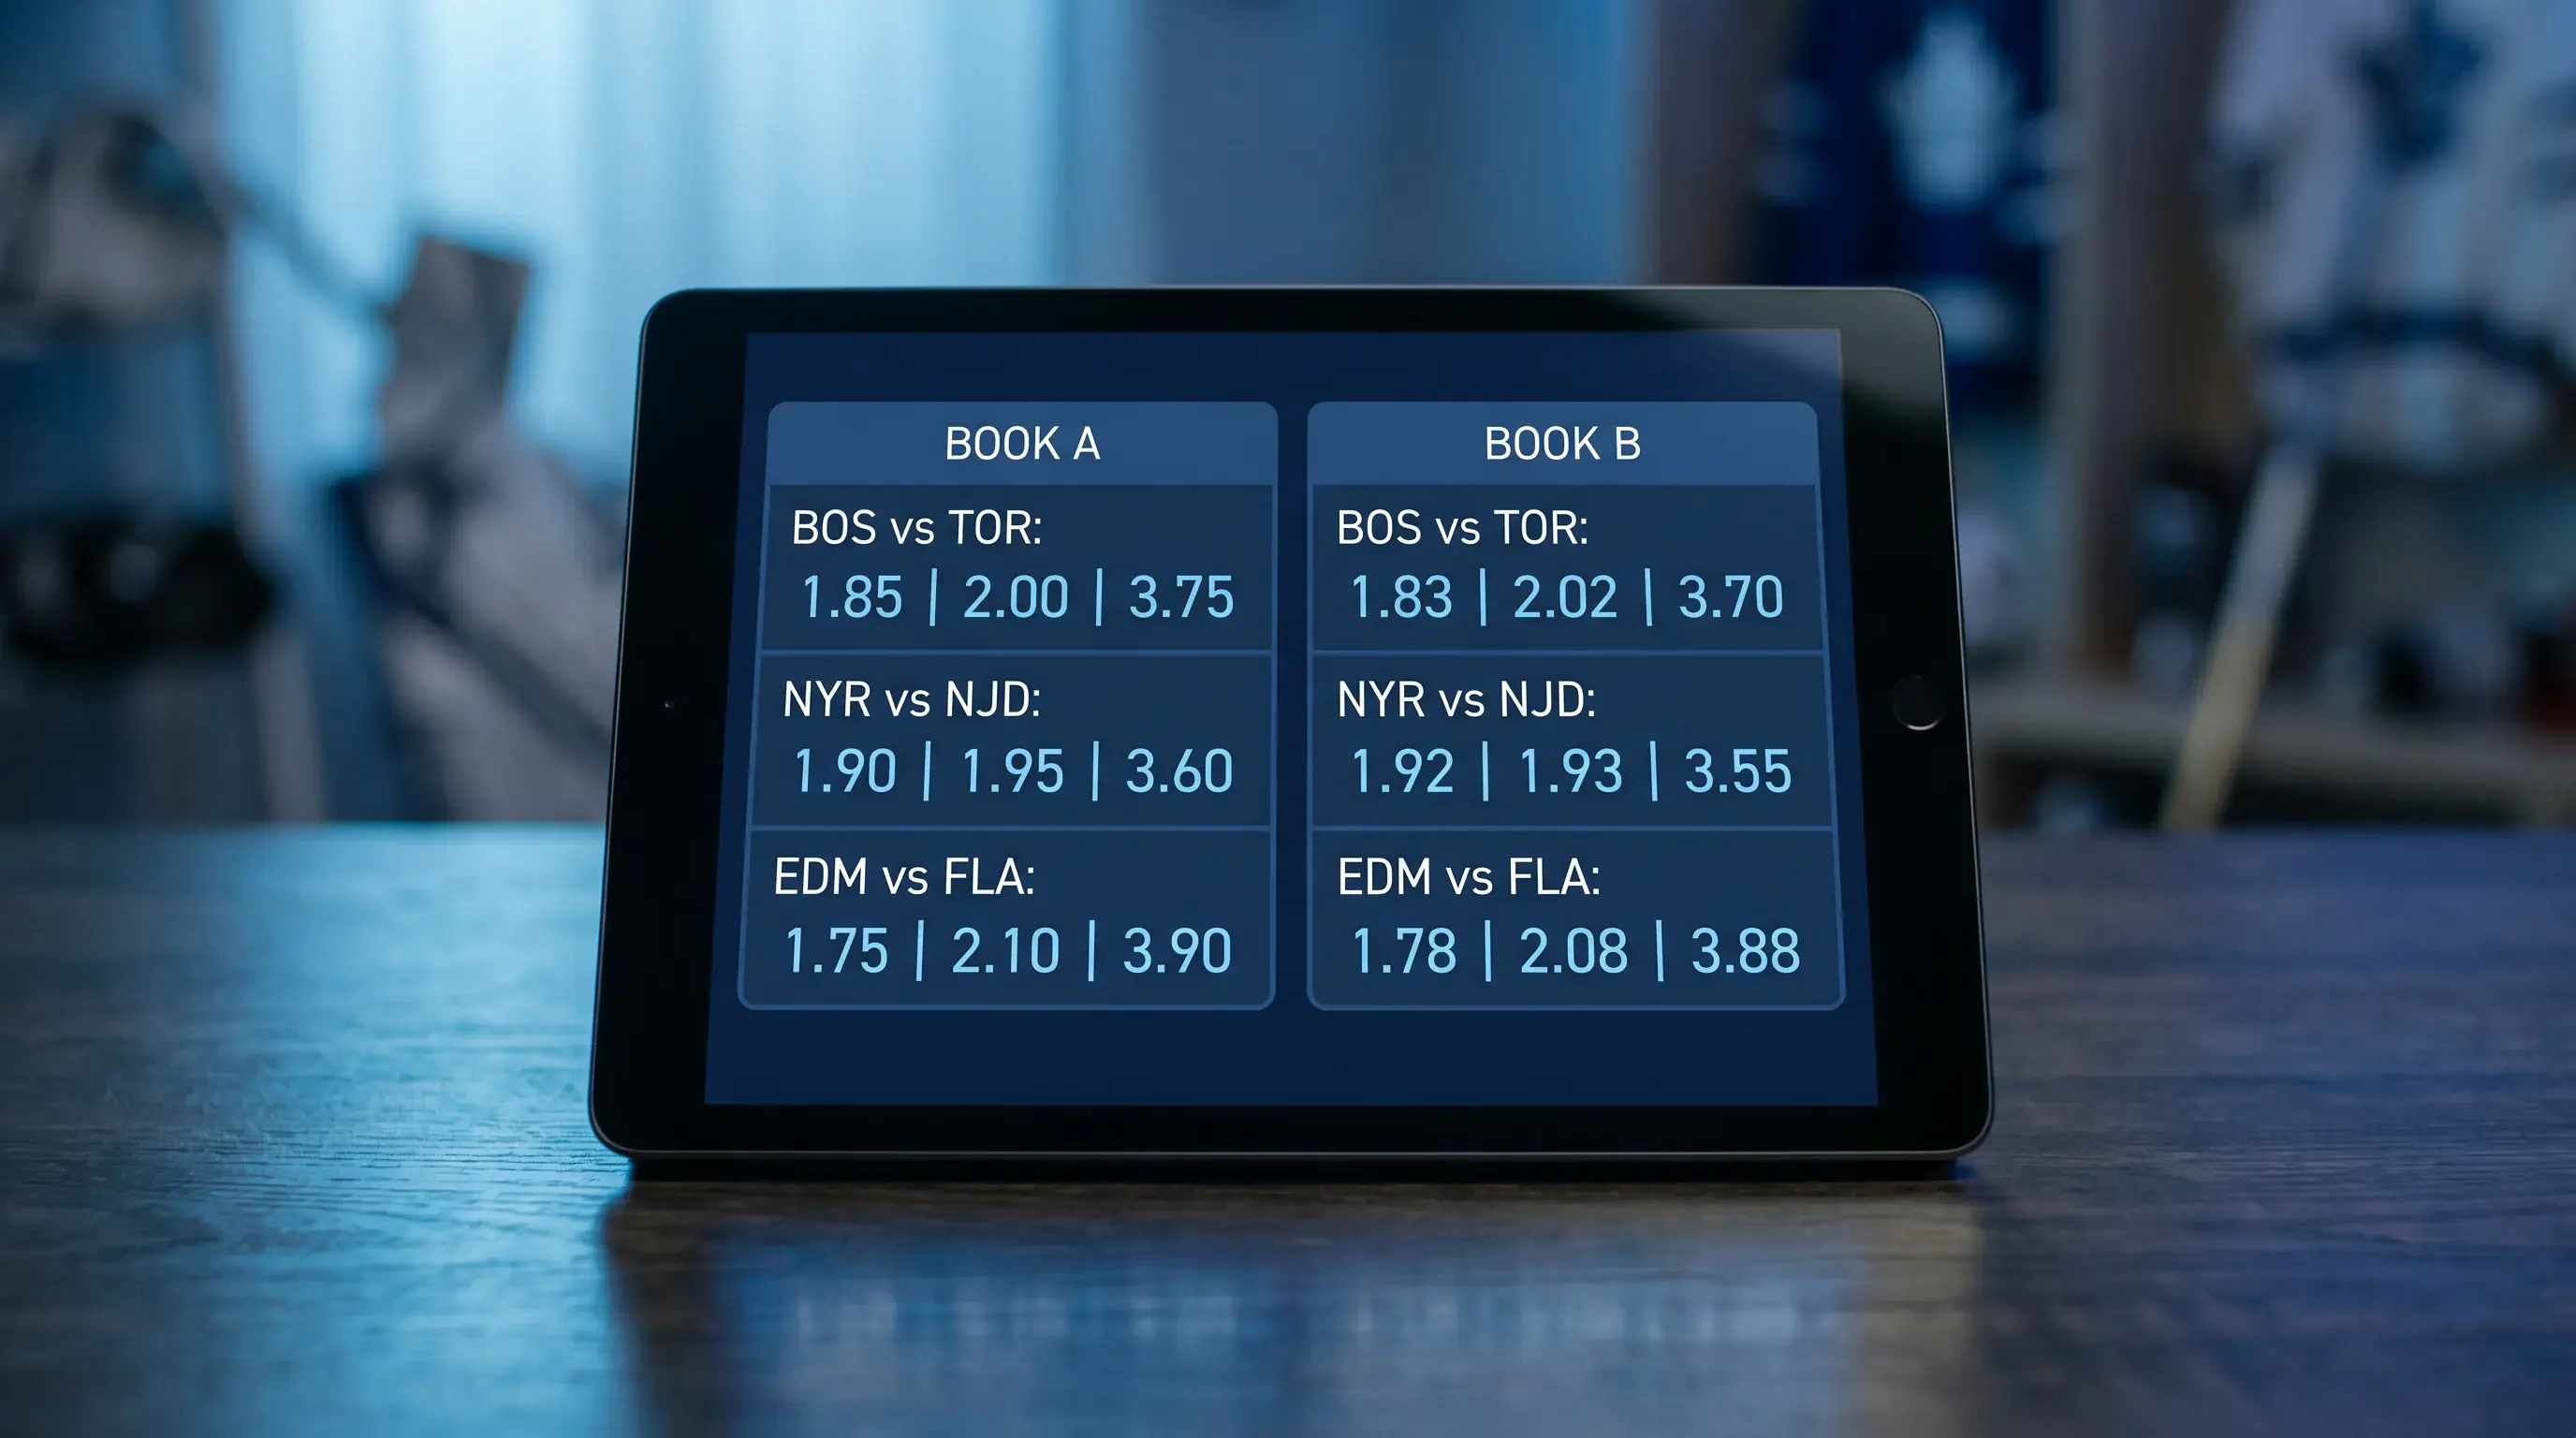
Margins are not uniform across markets or operators. Moneyline markets on high-profile NHL games — say, a Saturday night divisional rivalry — tend to carry tighter margins because bookmakers compete for volume. A Tuesday night game between two mid-table teams, where betting interest is lower, often carries a wider margin because the operator faces less competitive pressure to sharpen the price. Totals and puck line markets typically run slightly wider margins than moneylines, and prop bets wider still. The less liquid the market, the more the bookmaker charges you for access.
For a full walkthrough of how to calculate margins from any pair of odds and practical steps to reduce the vig you pay, the dedicated margins guide goes into the maths in detail. The short version: always check the overround before placing a bet, and if it exceeds 6% on a standard NHL moneyline, look for a better price elsewhere. Your edge is thin enough without giving unnecessary points back to the operator.
Why NHL Odds Move: Goalies, Injuries and Money
Open an NHL odds board at 10:00 GMT and check it again at 22:00 before puck drop. The numbers will have shifted — sometimes by a few cents, sometimes dramatically. Those movements are not random. They are signals, and learning to read them is one of the most valuable skills in NHL betting.
The single biggest mover of NHL odds is the goaltender announcement. A confirmed switch from a starting goalie to a backup can shift the moneyline by 10 to 20 cents in either direction within minutes. Goaltending is the single biggest factor in any NHL bet, and the market knows it. If you see a favourite drift from 1.65 to 1.75 in the hours before a game, check the goalie news first — that drift almost certainly reflects a backup getting the start. Conversely, if a line tightens sharply on a perceived underdog, the starter may have been confirmed where the market expected the backup.

Injuries to skaters move lines too, though the magnitude depends on the player. Losing a top-line centre or an elite defenceman might shift the moneyline by 5 to 10 cents. Losing a third-line winger rarely moves the needle at all. The market is efficient at pricing star-level absences but slower to adjust for depth losses that accumulate — three or four middle-six forwards out simultaneously can weaken a team more than any single headline injury, yet the line may not reflect it because each individual absence seems minor.
Then there is money. When a large volume of bets comes in on one side — whether from sharp syndicates or a wave of public money — the bookmaker adjusts the odds to balance liability. Sharp money tends to arrive early and in targeted amounts, moving the line efficiently. Public money tends to land closer to game time, often on favourites and overs, creating a late push that can sometimes overshoot fair value. If you have done your analysis early and identified your side, watching whether the line moves towards or away from your position tells you something useful about who agrees with you.
My rule of thumb: if the line moves against me by more than 10 cents after I have identified my bet but before I have placed it, I re-evaluate. Sometimes the market knows something I do not. Other times it is public money overreacting, and the move actually improves the value on my original side. Either way, I never chase a line — if the price has moved past my threshold, I pass and wait for the next opportunity.
Comparing Odds Across UK Bookmakers
With more than 80 online bookmakers licensed by the UK Gambling Commission, the range of NHL prices available to a UK punter on any given night is wider than most people realise. The problem is that most bettors open one app, find their game and tap “place bet” without ever checking whether the operator next door is offering a better price. That laziness has a cost, and over a full season it is not small.
Take a concrete example. Operator A prices a favourite at 1.67 and operator B at 1.72 on the same NHL moneyline. On a £20 stake, operator A returns £33.40 while operator B returns £34.40. One pound difference on a single bet. Across 150 bets in a season at that average gap, you are looking at £150 in lost value — purely from not shopping the line. No improved handicapping required, no advanced model, just the discipline to check two or three screens before confirming.

Odds comparison aggregators exist for exactly this reason. They pull prices from dozens of operators in real time and display them side by side. For NHL markets, coverage on these platforms is solid for moneylines and totals but can be patchier for props and alternative lines. I keep accounts with three or four bookmakers that consistently offer competitive NHL pricing and check each one before every wager. The accounts cost nothing to maintain, and the cumulative value they unlock over a season more than justifies the minor inconvenience of switching between apps.
One nuance specific to NHL: prices tend to be most competitive on high-profile games and widest on midweek matchups between smaller-market teams. If you are betting a Tuesday night game between two teams outside the playoff picture, the odds disparity across operators can be notably larger than on a Saturday night Original Six matchup. That is precisely when line shopping matters most — and when most people bother least.
NHL Odds vs Football Odds: What UK Bettors Should Expect
If your betting background is Premier League or Champions League football, NHL odds will feel different the moment you open the market. The structure is not exotic, but the calibration is — and misunderstanding it can lead to poor decisions on your first few hockey bets.
The most obvious difference is the absence of the draw. In football, the three-way market (home, draw, away) spreads probability across three outcomes, which means individual prices tend to be longer. In hockey, the moneyline is a two-way market — one team wins, the other loses, overtime and shootouts decide tied games. With only two outcomes, both sides carry shorter prices. A typical NHL moneyline might read 1.75 vs 2.15, whereas a comparable Premier League fixture could show 2.40, 3.20 and 3.10 across three outcomes. If you are used to routinely backing odds north of 2.50 in football, NHL prices will feel compressed at first.
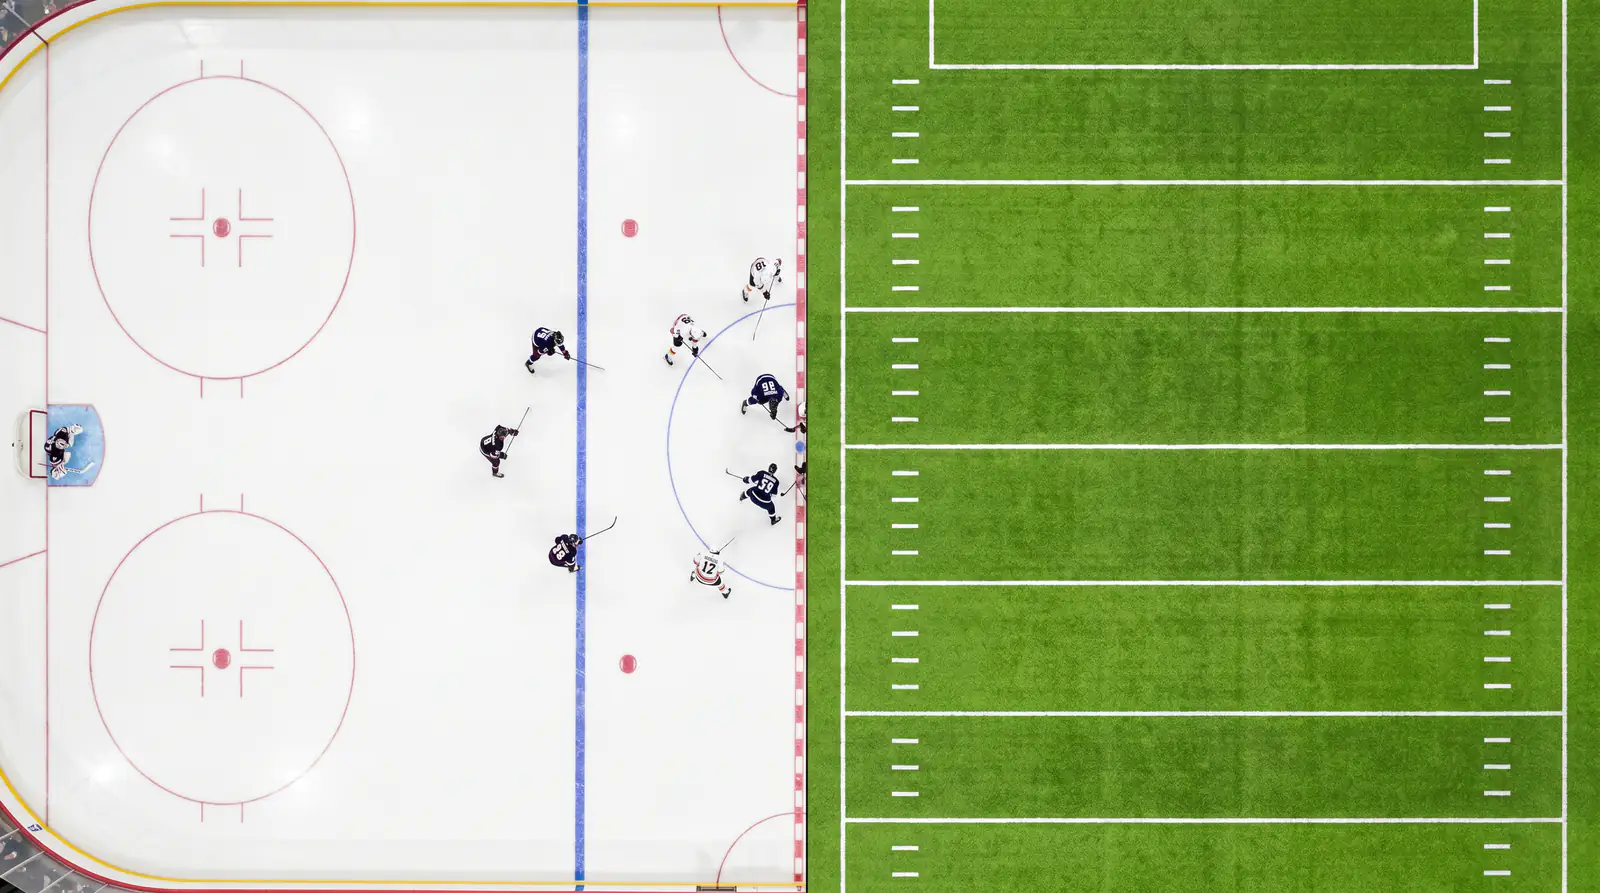
Margins on NHL markets in the UK run between 4% and 6%, which is slightly wider than what you find on top-tier football matches — Premier League moneylines often sit in the 2% to 4% band because of the enormous volume they attract. The gap narrows on marquee NHL fixtures and widens on lower-profile games. If you are accustomed to the razor-thin margins of a Premier League Saturday, expect to pay a little more in overround when you move to hockey. That makes line shopping even more important in NHL than it already is in football.
The tempo of odds movement differs too. Football odds settle relatively early because squad information is usually available well in advance. NHL odds remain volatile much closer to game time because goaltender announcements drop late, often only a few hours before puck drop. This creates both risk and opportunity: if you can wait for full information before placing your bet, you will avoid the stale-price trap that catches impatient punters. The flip side is that waiting means you sometimes miss a favourable early price that moves against you once the goalie is confirmed. Timing is a skill in itself, and it matters more in NHL markets than in almost any football league.
NHL Betting Odds FAQ
Why do NHL odds change after the starting goalie is announced?
Goaltending is the single most influential variable in an NHL game. A switch from a starter to a backup can shift the moneyline by 10 to 20 cents because the market reprices the expected goal output on both sides. Totals also adjust, typically moving higher when a weaker goaltender is confirmed. This movement happens within minutes of the announcement, so checking odds after the goalie is named is essential.
What odds format do UK bookmakers use for NHL?
Most UK online bookmakers default to decimal odds for NHL markets, though fractional odds are available as a display option on nearly every platform. Decimal is the most practical format for quick comparison and payout calculation: simply multiply your stake by the decimal number to get your total return including the original stake.
How do NHL betting margins compare to Premier League markets?
NHL moneyline margins in the UK typically range from 4% to 6%, while top-tier Premier League matches often carry margins of 2% to 4% due to higher betting volume and greater competition among operators. The gap is most pronounced on lower-profile midweek NHL games. Line shopping across multiple bookmakers helps offset the wider margins.
What does a minus sign mean in American NHL odds?
A minus sign in American odds indicates the favourite and shows how much you need to stake to profit 100 units. For example, -150 means you must wager 150 to win 100 in profit. To convert to decimal odds, divide 100 by the absolute value and add 1: -150 becomes 1.67 in decimal. UK punters rarely need this format day-to-day but will encounter it on US-based analysis sites and line trackers.
Prepared by the NHL Hockey Bets editorial staff.