NHL Value Betting: How to Find Mispriced Lines Before They Move
 Available in US
Value Is the Only Edge That Lasts
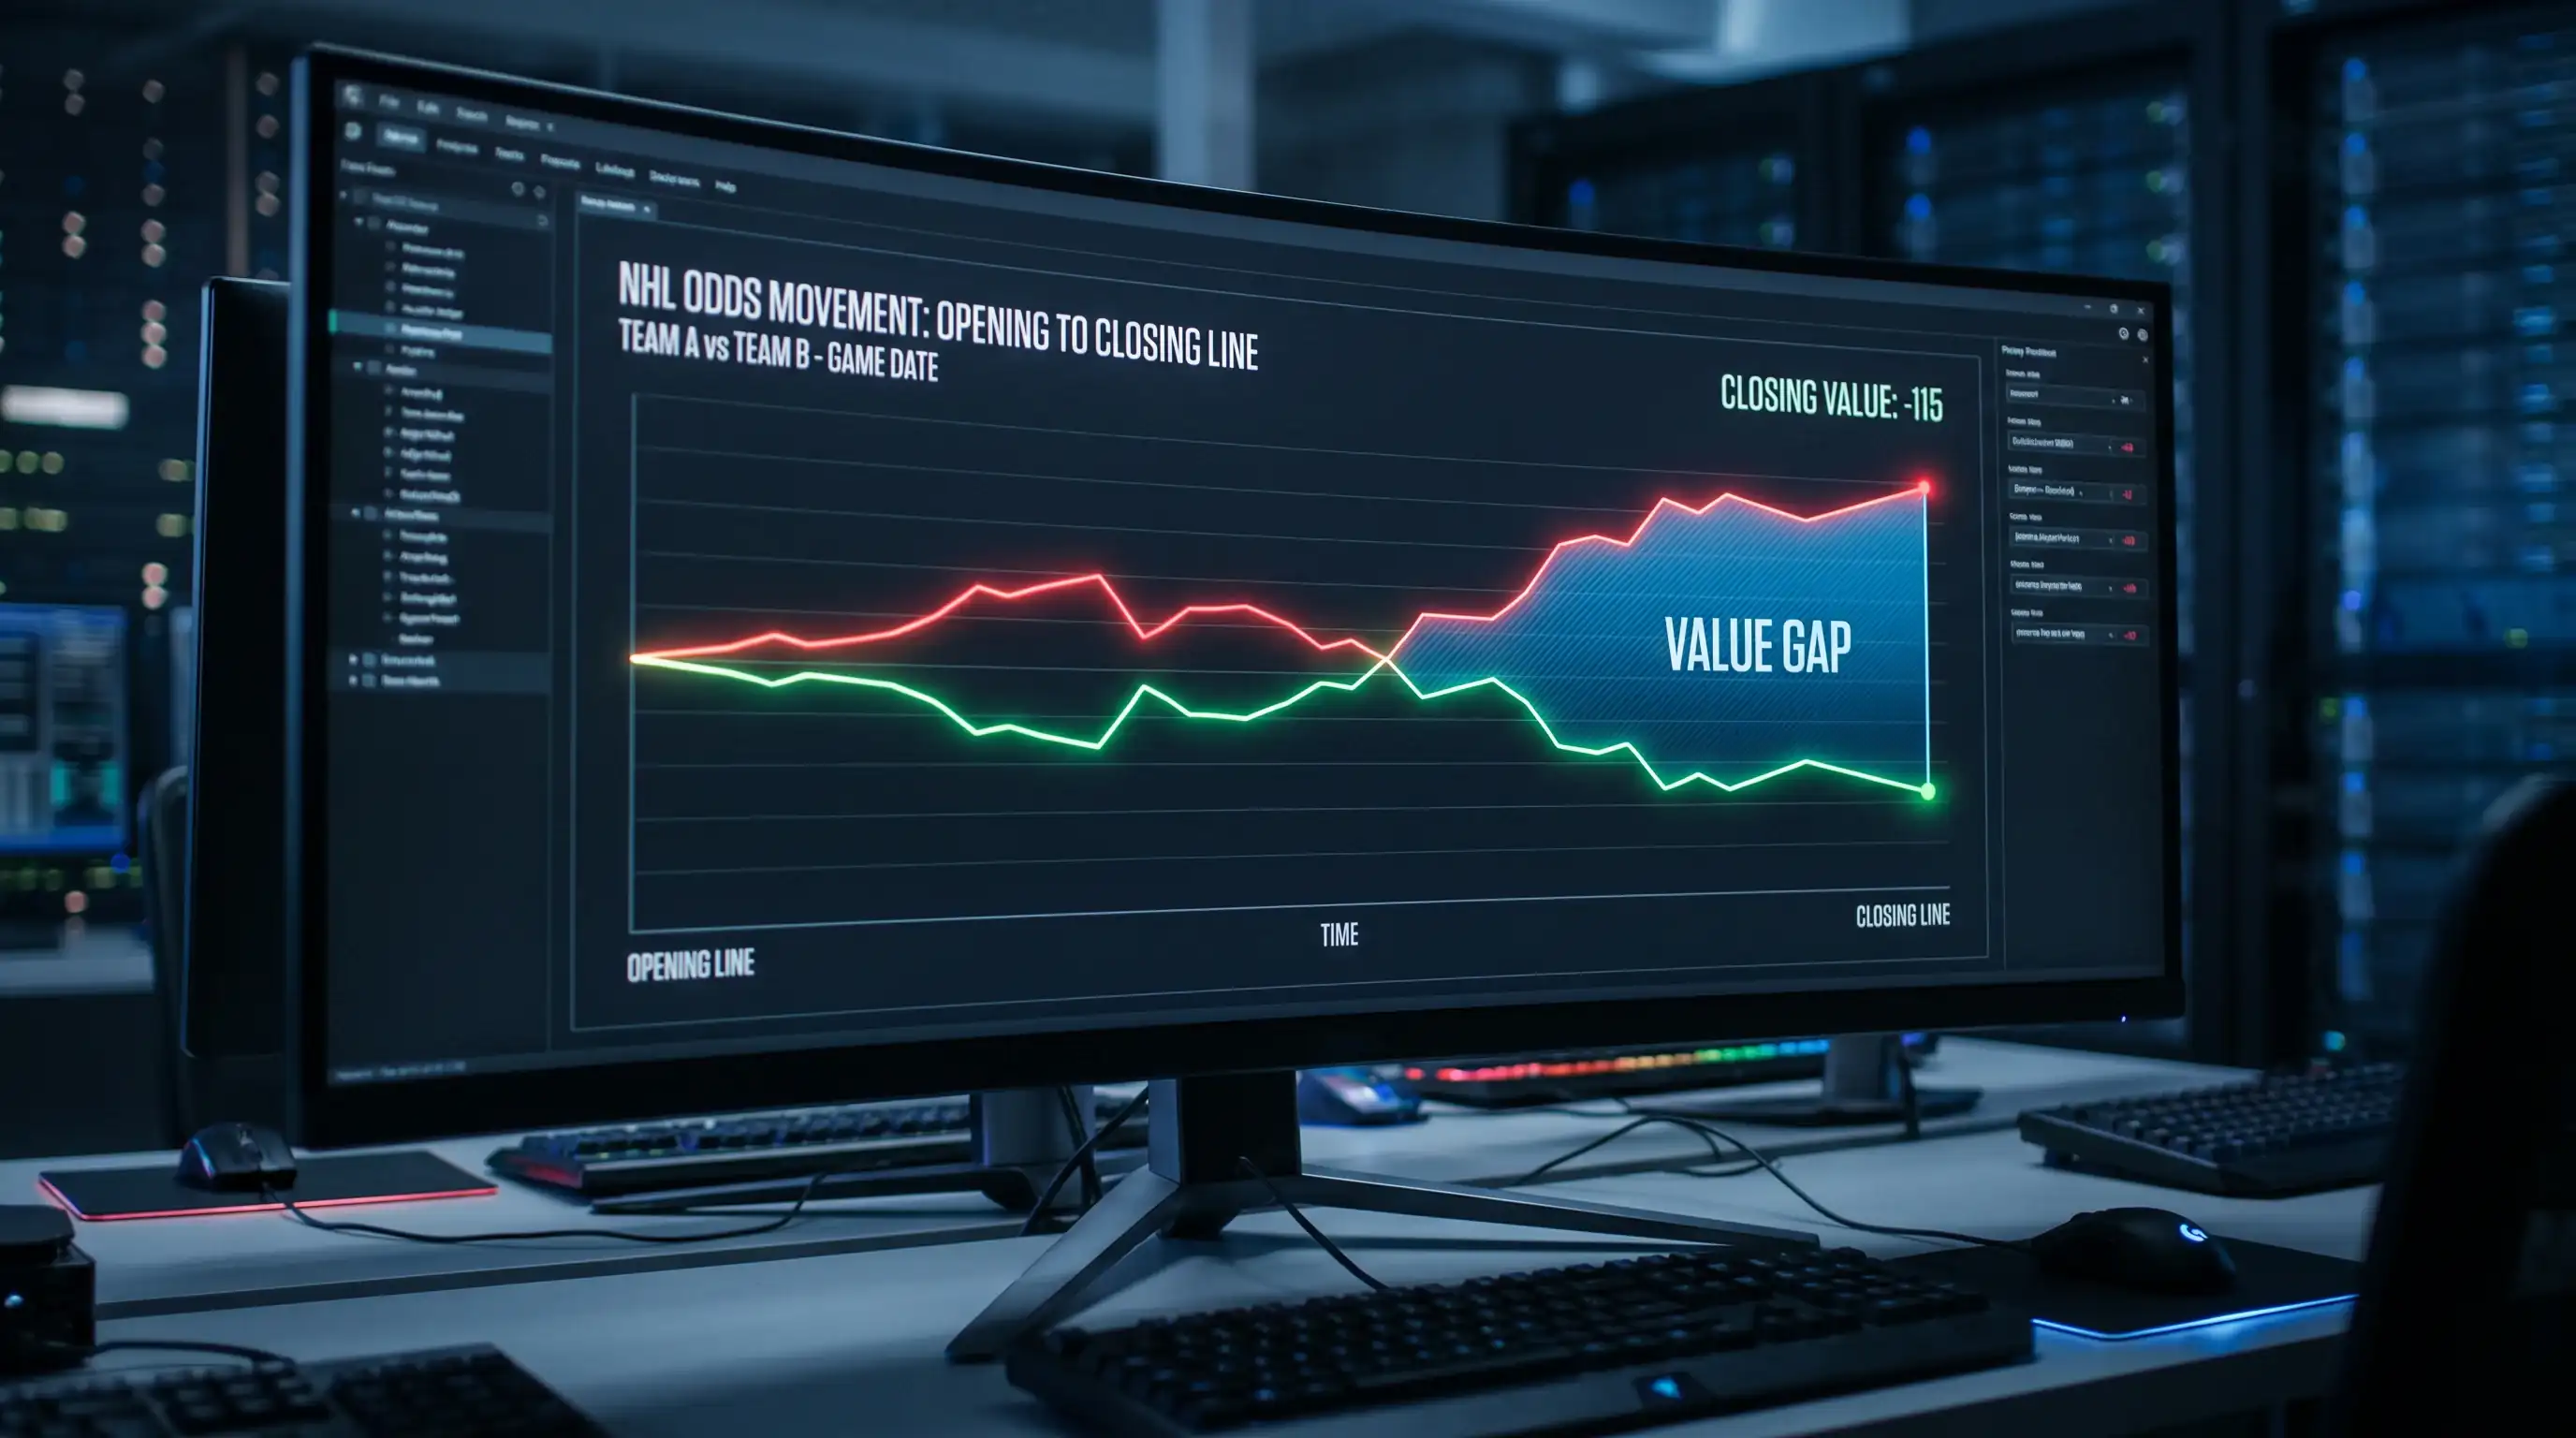
Early in my betting career I chased winners. I wanted to pick the team that would win tonight, and I measured success by whether the scoreboard agreed with me. It took two losing seasons to realise the flaw in that thinking: picking winners is not the same as finding value. A favourite at 1.25 who wins 75% of the time is a losing bet — the price demands an 80% win rate just to break even. A underdog at 3.00 who wins 38% of the time is a profitable bet, because the price only requires 33%. Value is the gap between what the odds imply and what actually happens, and it is the only sustainable edge in a market as competitive as the NHL.

NHL underdogs won 39.1% of games in 2024/25, the second-highest upset rate in North American professional sport. That baseline parity is what makes value betting in hockey so productive — the gap between perceived probability and actual probability is wider and more persistent than in football or basketball, where dominant teams separate more cleanly from the pack. In hockey, even the weakest roster can beat the strongest on any given night, and the bookmaker cannot price that randomness away entirely.
Expected Value: the Math Behind Every Smart Bet
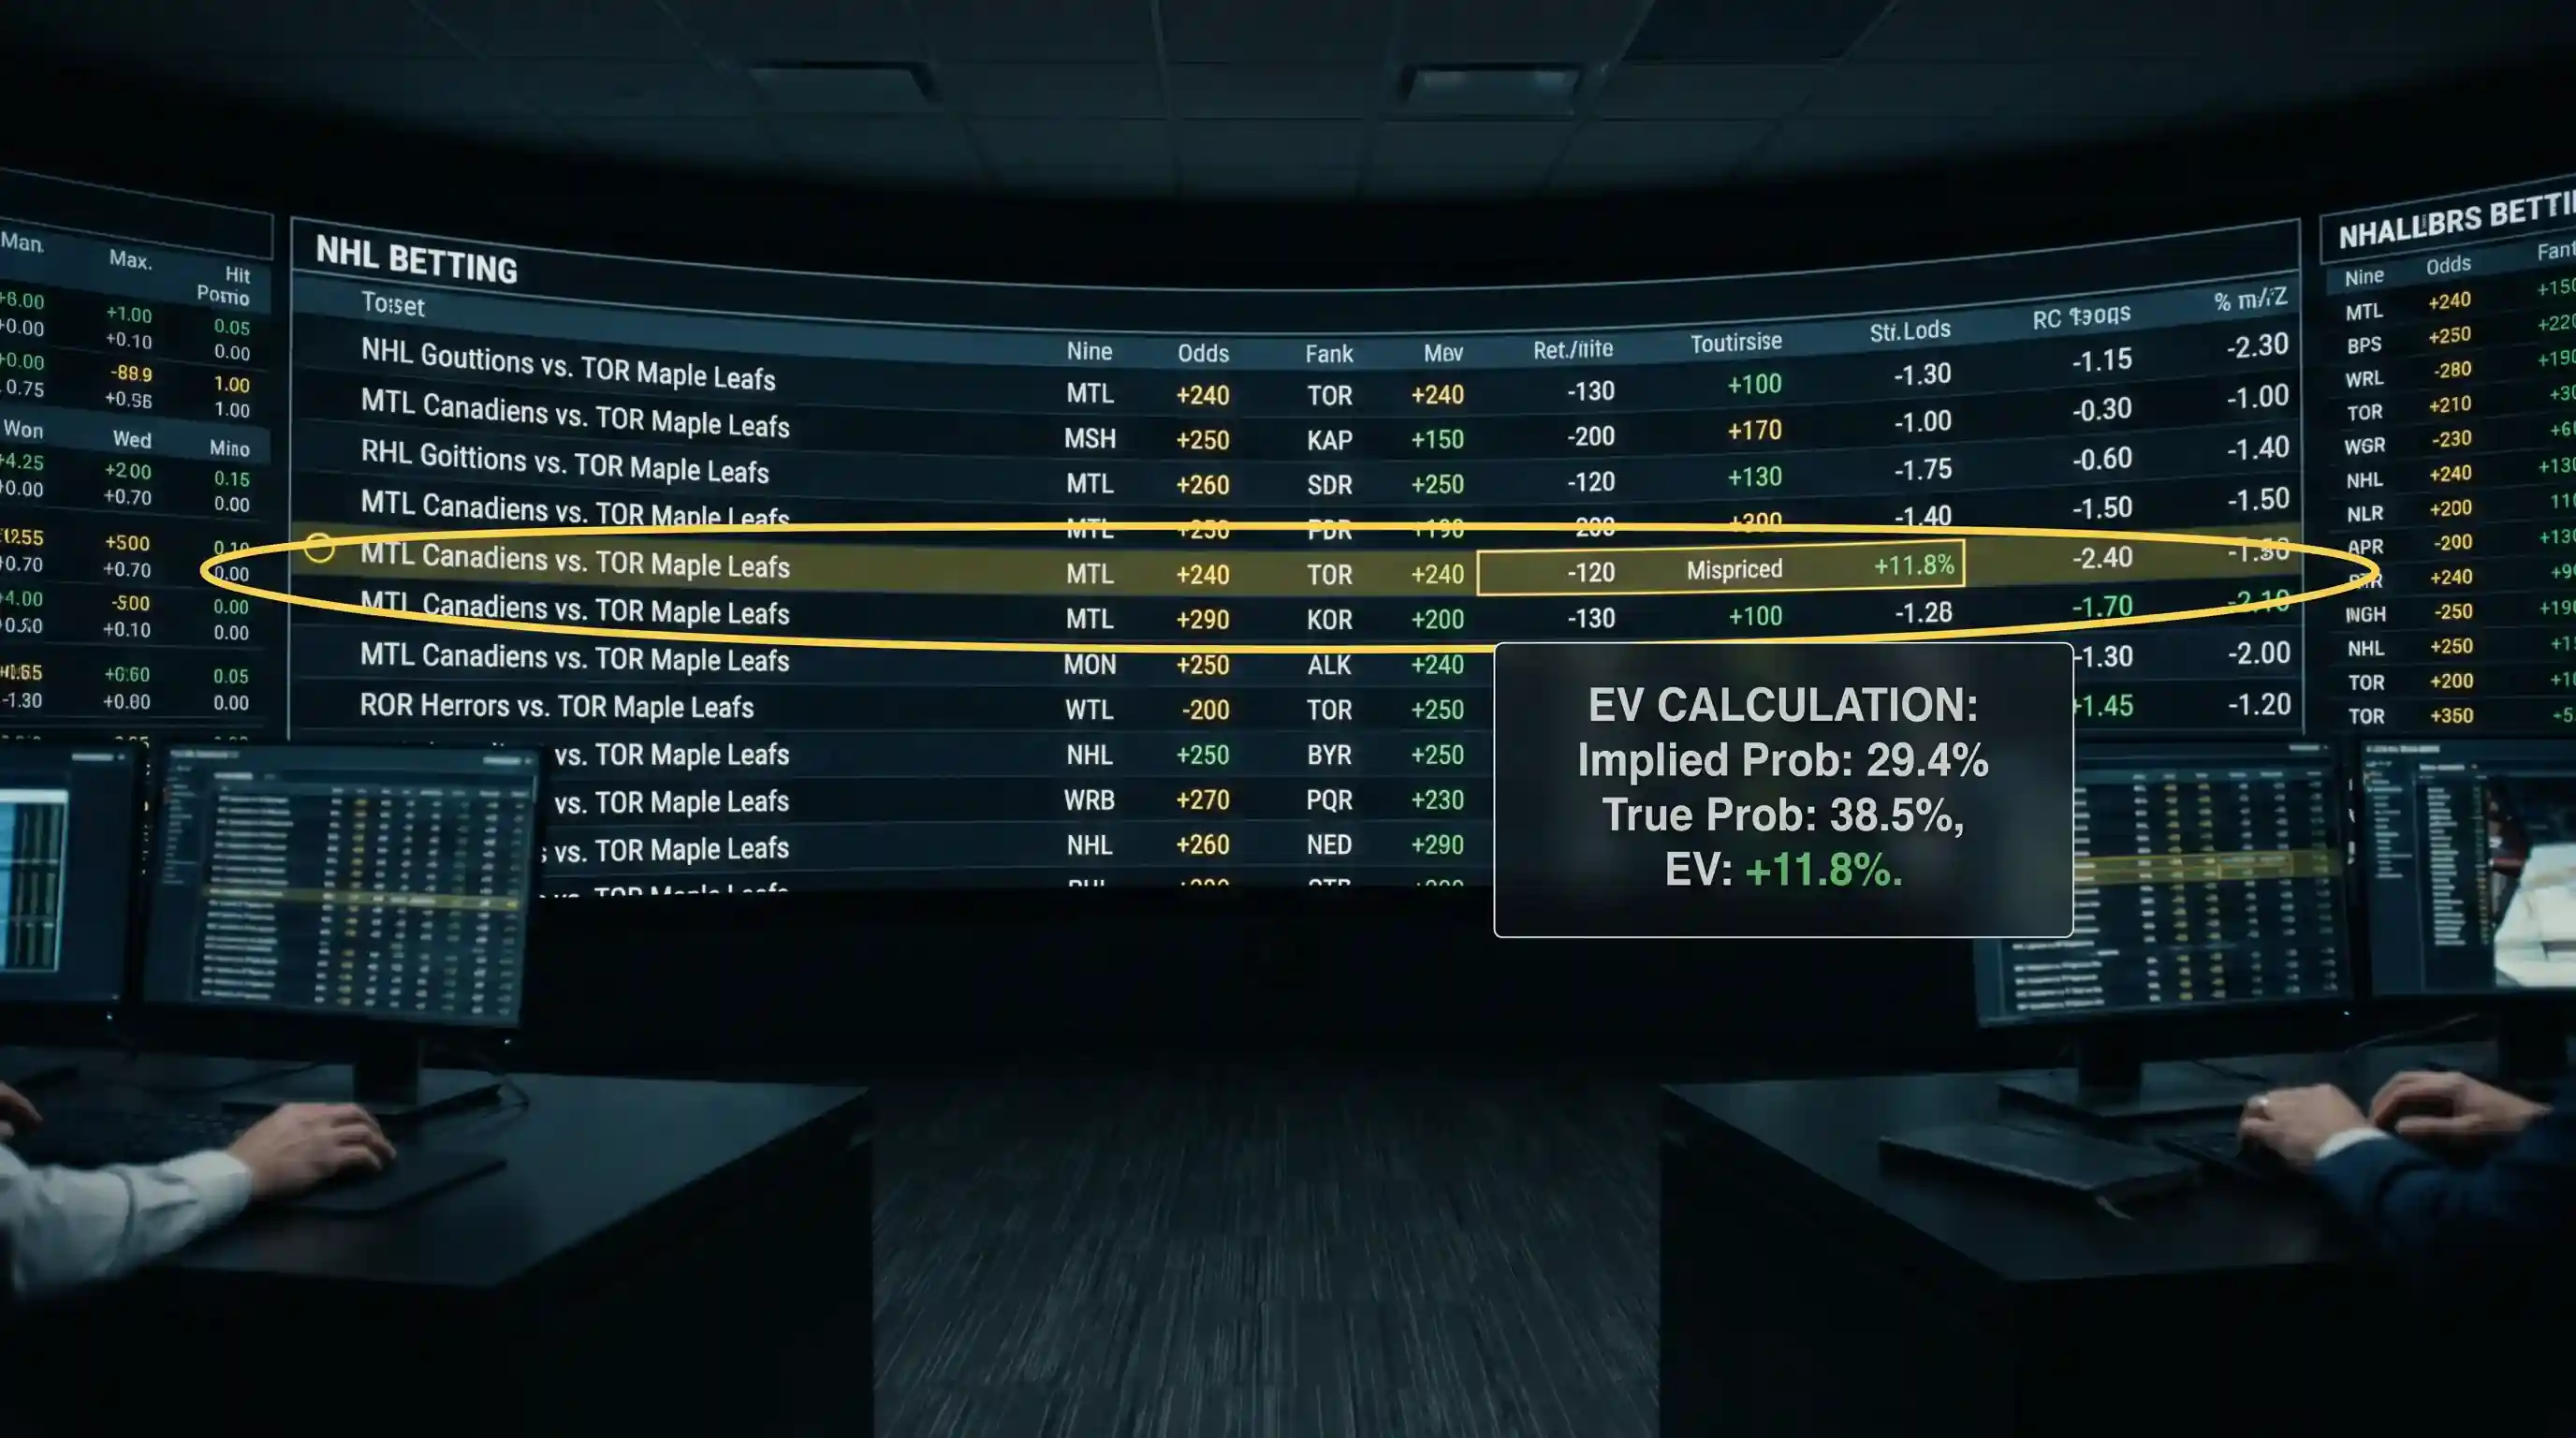
Expected value, or EV, is the mathematical expression of whether a bet is worth taking over the long run. The formula is simple: multiply the probability of winning by the profit if you win, then subtract the probability of losing multiplied by the stake you lose. If the result is positive, the bet has positive expected value (+EV). If negative, you are paying more than the outcome is worth.
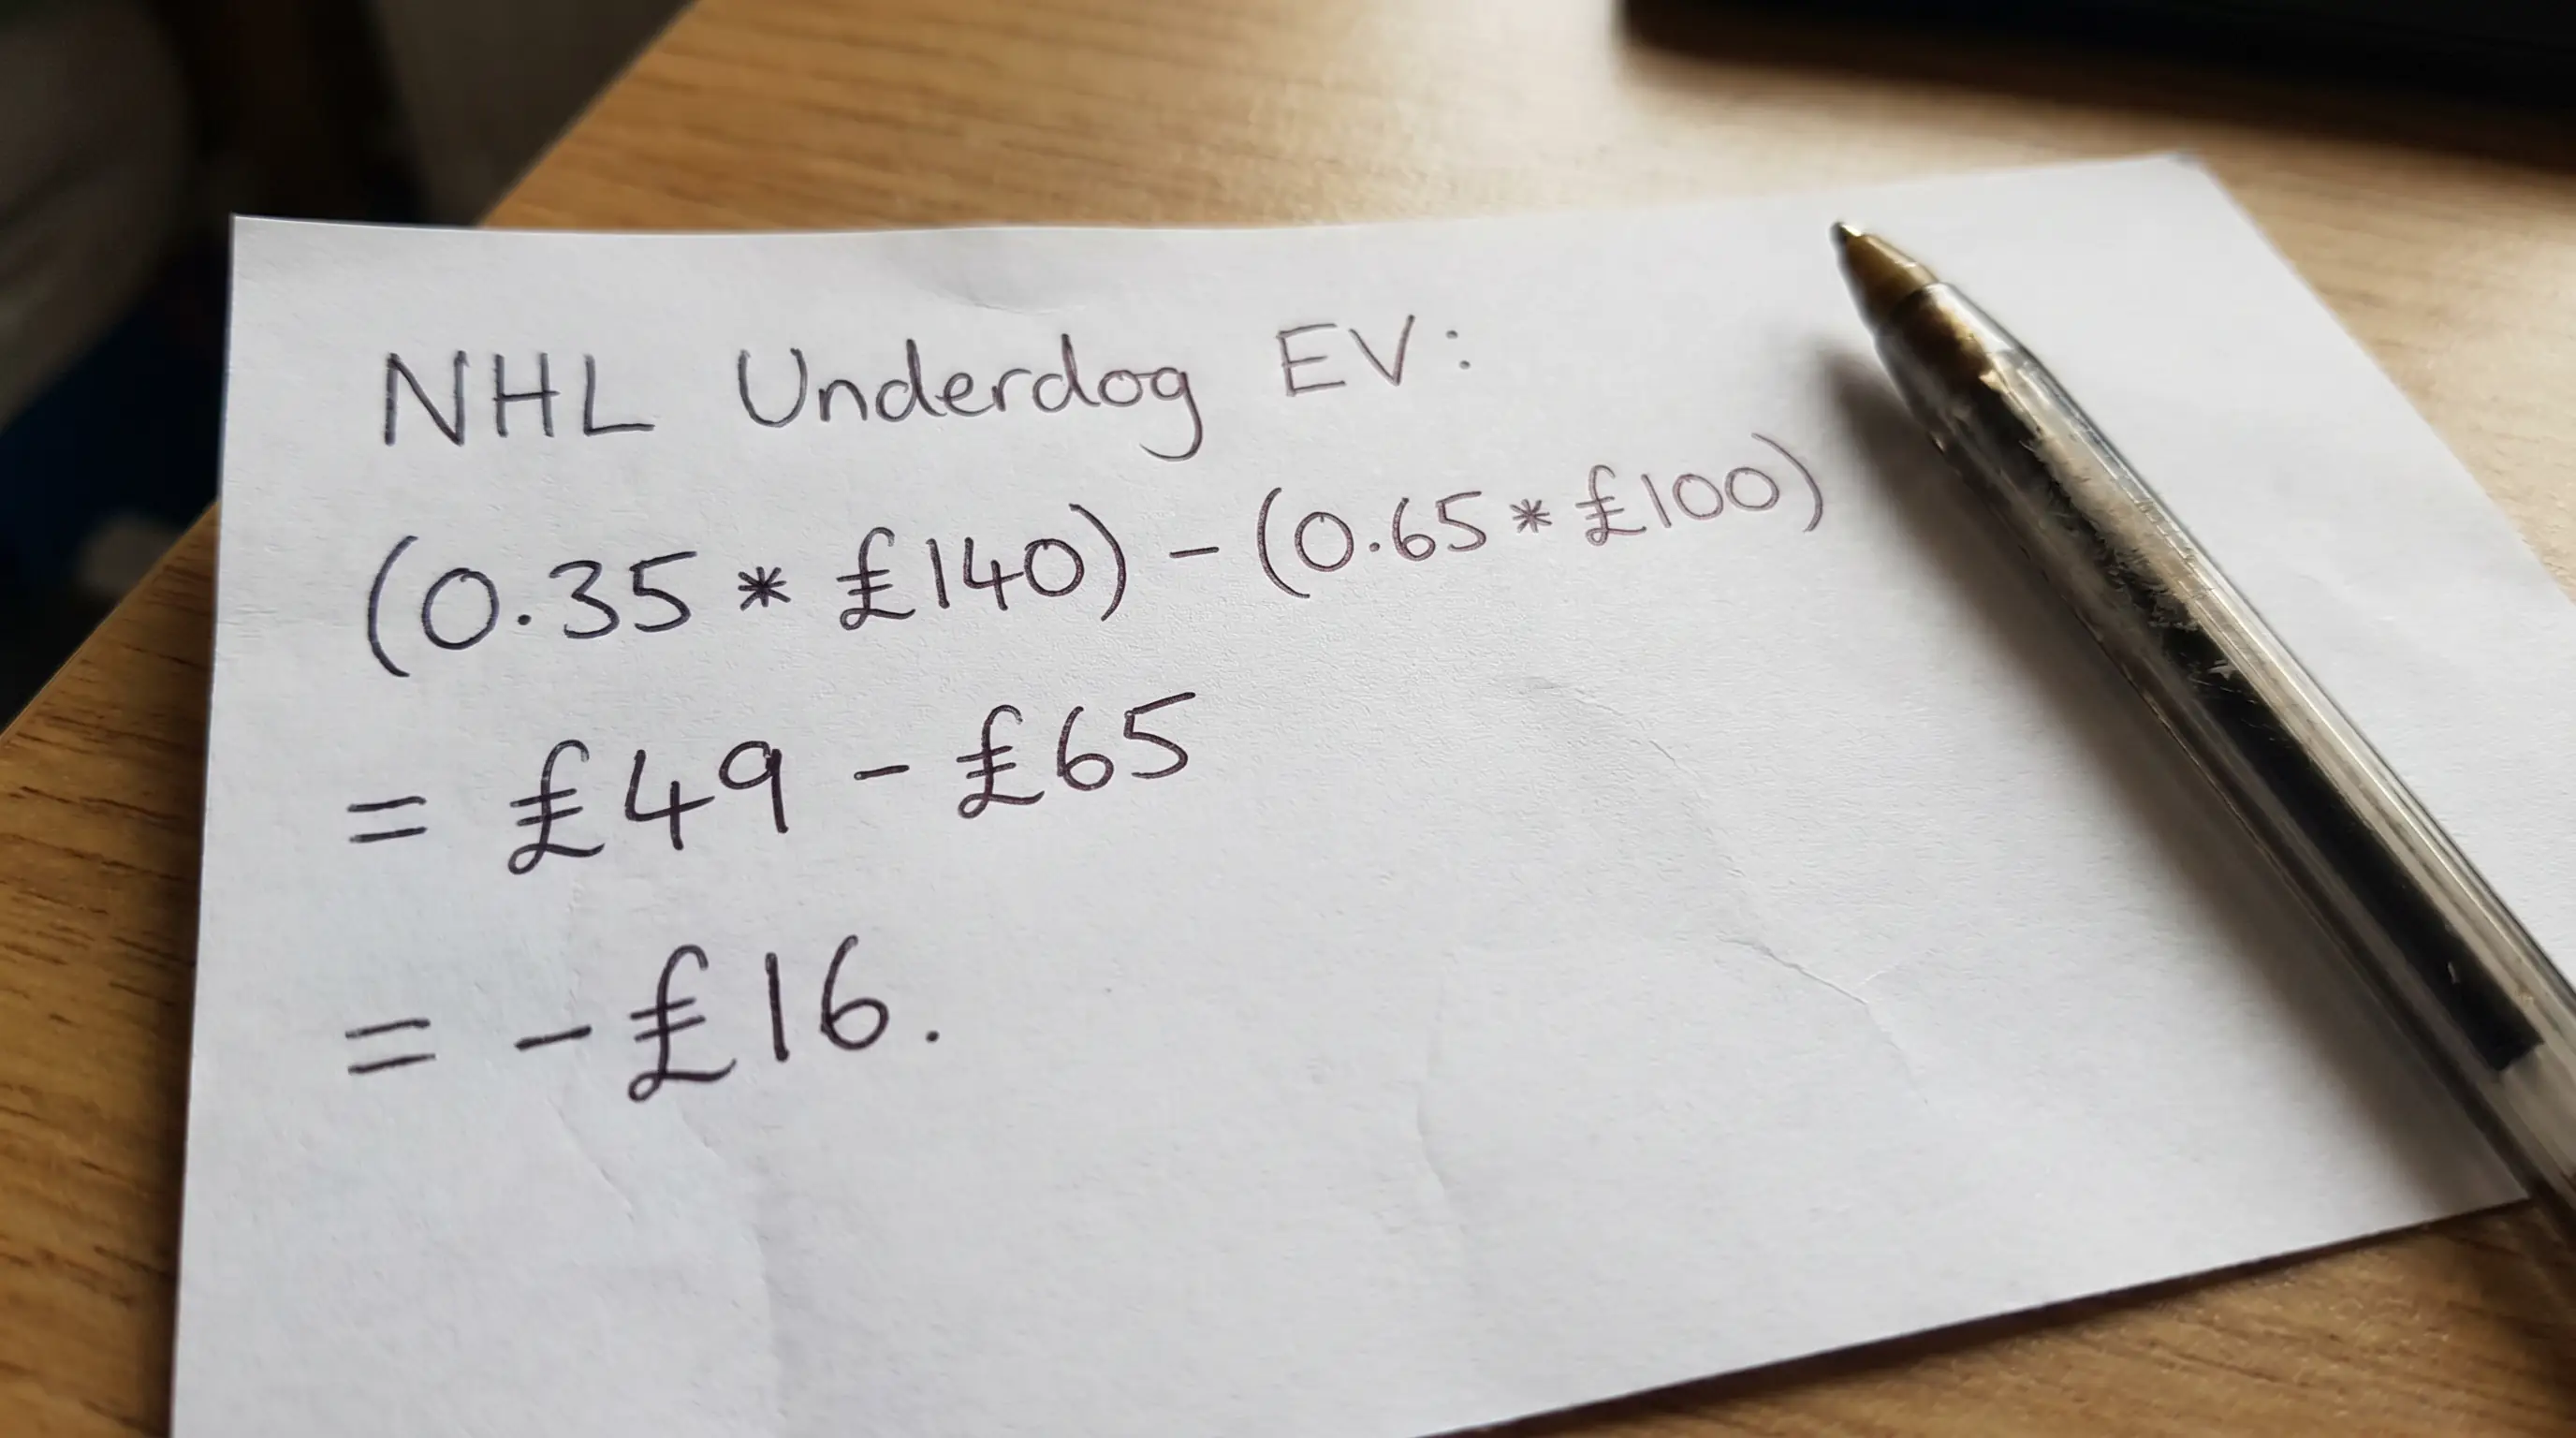
Here is a concrete example. You believe a team has a 45% chance of winning tonight. The bookmaker offers decimal odds of 2.40. Your EV calculation: (0.45 x 1.40) minus (0.55 x 1.00) = 0.63 minus 0.55 = +0.08. For every pound staked, you expect to earn eight pence in the long run. That is a +EV bet. If the bookmaker instead offered 2.10 on the same 45% probability, the calculation flips: (0.45 x 1.10) minus (0.55 x 1.00) = 0.495 minus 0.55 = -0.055. Negative EV. Same game, same team, different price — and the difference between a smart wager and a losing one.
The hard part is not the arithmetic. It is estimating the true probability accurately enough to trust your number over the bookmaker’s implied probability. That requires a model, whether it is a spreadsheet tracking expected goals and Corsi differentials or simply a disciplined process of assessing goaltending matchups, schedule spots, and home-ice effects. Without your own probability estimate, you cannot calculate EV — and without EV, you are guessing.
Where NHL Markets Misprice Most Often
Not every NHL game offers value. Most lines are efficient enough that neither side has a meaningful edge. The skill is knowing where the inefficiencies cluster — the structural blind spots where bookmaker models and public perception consistently diverge from reality.

Home underdogs on the puck line are the most documented mispricing in NHL betting. Home underdogs covered +1.5 in 63.9% of games during 2024/25, yet the prices on +1.5 regularly imply a lower probability. The gap exists because the public gravitates toward favourites, compressing the favourite’s price and inflating the underdog’s. BettorEdge research highlighted a related effect: Canadian teams often see inflated lines due to hometown bias, which creates value for those betting against them. That inflation is a specific, measurable instance of public money distorting a line away from its true probability.

Back-to-back schedule spots create another pocket of mispricing. Away teams on the second night of a back-to-back won just 40% of games since 2023 — a significant underperformance against the baseline. But bookmakers do not always discount these teams aggressively enough, particularly when the fatigued team is a public favourite. The opponent’s moneyline in these spots frequently offers +EV, because the market underweights fatigue relative to its actual impact.
Goalie-driven line movements are the third source. When a team announces its backup goaltender, the moneyline shifts — but the shift does not always match the actual performance gap between starter and backup. If the backup is league-average and the line moves as though a below-average goaltender is starting, the team’s price becomes longer than it should be, creating value on a side the public is now avoiding.
Tracking Your Bets to Prove or Disprove Your Edge
Claiming you have an edge is easy. Proving it requires a record. I track every bet I place in a spreadsheet that logs the date, teams, market, odds taken, closing odds, stake, result, and my estimated probability at the time of the bet. After 200 bets, that record starts to tell a story — and the story is either “your model identifies +EV spots consistently” or “your edge is an illusion sustained by a hot streak.”

The single most important column in that spreadsheet is closing line value, which measures whether you consistently bet at prices better than the closing line. If you do, your model is identifying value before the market corrects. If you do not, you are either betting too late, overestimating your probability estimates, or both. Tracking closing line value across a full season is the most honest self-assessment available to any bettor.
Discipline means accepting what the record tells you. If after 300 bets your estimated probabilities are not calibrated — you estimated 50% win probability on bets that actually won 42% of the time — the model needs adjustment, not more volume. Value betting is a process of continuous refinement: estimate, bet, record, review, adjust. Skip any step and the process breaks down, leaving you with opinions instead of evidence.
What is expected value in NHL betting?
Expected value (EV) measures the average profit or loss per bet over the long run. It is calculated by multiplying the win probability by the profit, then subtracting the loss probability multiplied by the stake. A positive EV bet returns more than it costs on average. Finding +EV bets requires estimating the true probability of an outcome more accurately than the bookmaker’s implied probability.
Can casual bettors find value in NHL markets?
Yes, particularly in areas where public perception diverges from data. Home underdogs on the puck line, teams facing fatigued back-to-back opponents, and goalie-driven line movements are documented sources of mispricing that do not require a complex model to identify. Even a simple checklist covering schedule spots, goalie confirmation, and line comparison across bookmakers gives casual bettors a framework for spotting value.
Created by the ”NHL Hockey Bets” editorial team.