NHL Salary Cap and Betting: How Roster Economics Shape the Odds
 Available in US

Why the Cap Ceiling Matters More Than the Scoreboard for Futures
Most bettors look at the standings when placing a futures bet. I look at the salary cap. The standings tell you what happened last month. The cap tells you what can happen next season, and the season after that. It is the structural constraint that determines which teams can add talent, which are locked into their current roster, and which face painful decisions that weaken them from within. If you understand the cap, you see futures markets differently — and differently is where the money is.

The NHL operates under a hard salary cap, meaning no team can spend more than the designated ceiling on player salaries. Unlike football’s Financial Fair Play or basketball’s luxury tax, there is no mechanism to exceed the limit by paying a penalty. You either fit under the cap or you shed players until you do. That rigidity creates predictable patterns: teams approaching the ceiling make trades to clear space, contenders at the deadline add pieces by absorbing expiring contracts, and every summer a reshuffling occurs as cap hits expire and new deals are signed.
Gary Bettman framed the league’s financial trajectory in characteristically optimistic terms, noting that the trending is very positive and that the marketplace will ultimately determine the true value of franchises. That optimism is grounded in numbers: total franchise values across the NHL exceed 67 billion USD collectively, and average club EBITDA grew 20% year on year to 54 million in 2024/25. A richer league means a higher cap, which means more roster flexibility for teams that manage their finances well.
NHL Salary Cap 2025-2028: Rising Ceiling, Shifting Rosters
The cap ceiling sits at 95.5 million USD for the 2025/26 season. Projections put it at 104 million for 2026/27 and 113.5 million for 2027/28 — a rise of more than 25% in just three years. That escalation is the most significant structural change in the NHL’s competitive landscape since the cap was introduced after the 2004-05 lockout, and its betting implications are enormous.
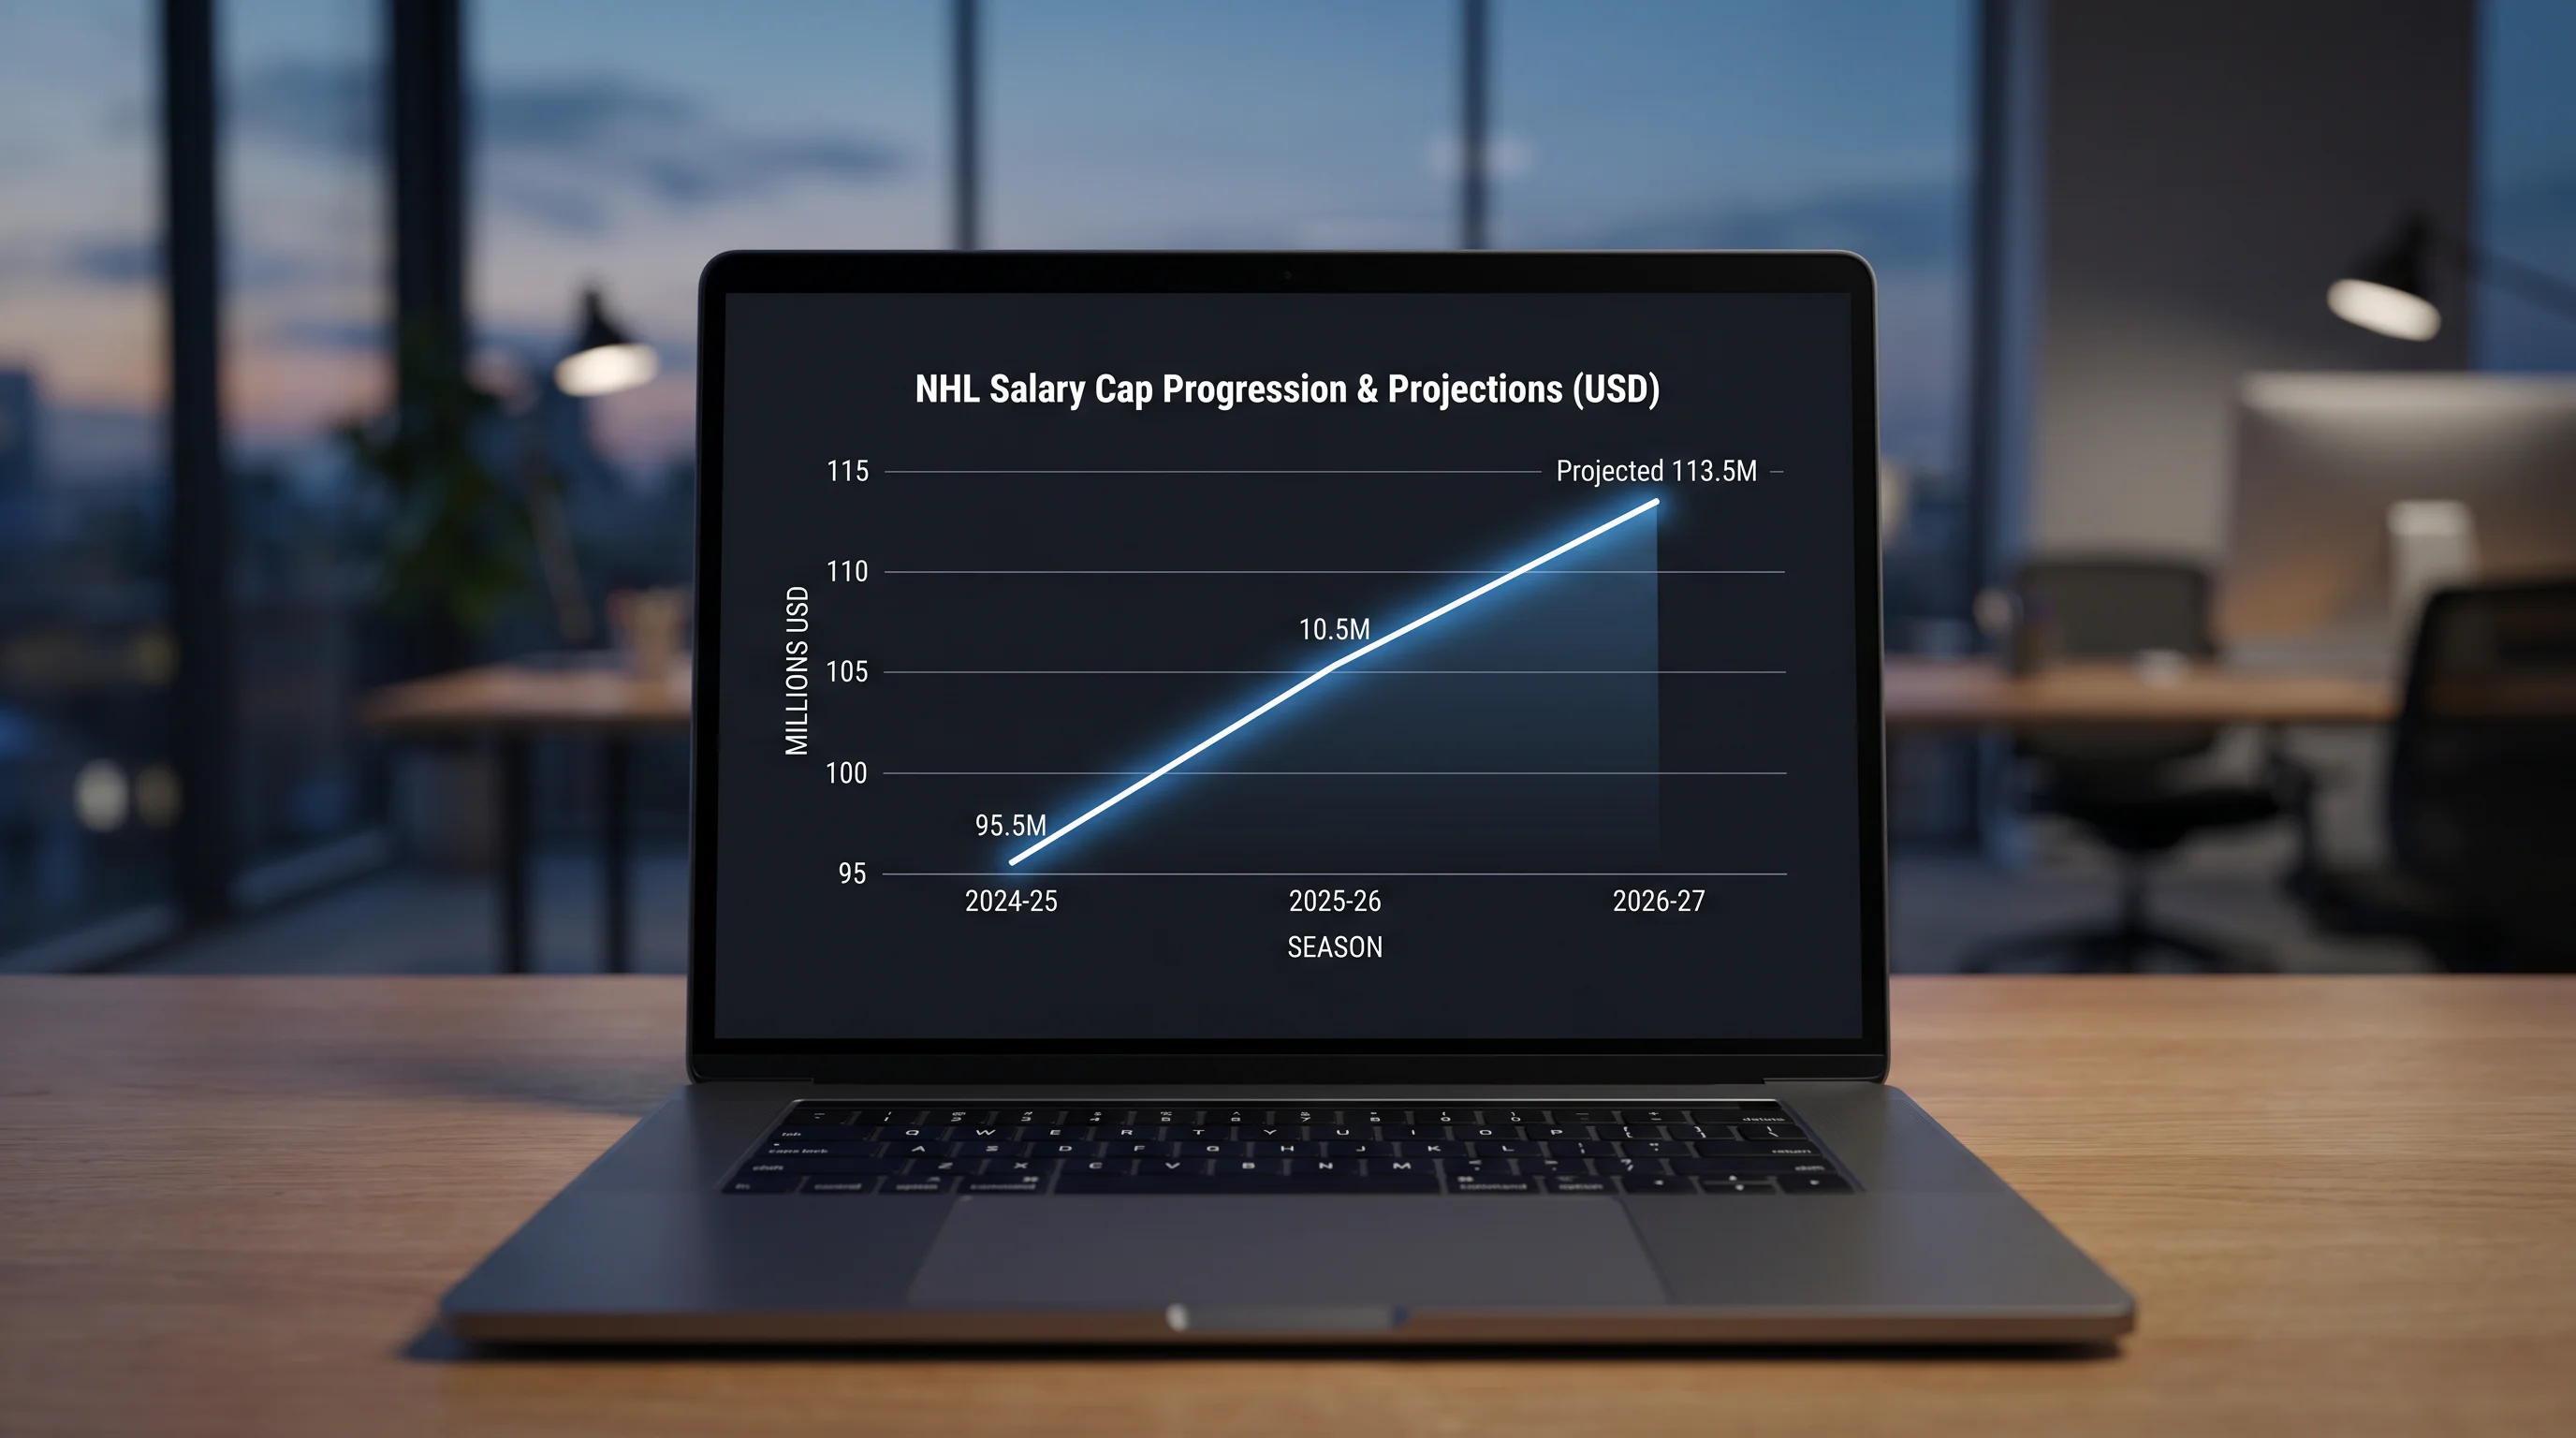
Teams that built their rosters for a lower cap suddenly have room to breathe. A franchise that was pinned against the 83.5 million ceiling two years ago now has 12 million in additional space — enough to add a top-six forward or a starting goaltender. Conversely, teams that signed long-term contracts at higher cap percentages when the ceiling was lower will see those deals consume a shrinking share of the total, making their existing rosters relatively cheaper and freeing money for depth additions.
The betting angle is directional. Teams entering a season with significant projected cap space — say, 15 million or more — have optionality. They can improve through trade or free agency, which means their pre-season futures price carries embedded upside that the market may not fully reflect. Teams at or above the ceiling have no optionality; what you see is what you get, and any injury to a high-salaried player creates a hole that cannot be filled without a corresponding cap manoeuvre.
Tracking cap space is straightforward. Sites like CapFriendly and PuckPedia publish real-time cap data for every NHL team, including projected space for future seasons. Cross-referencing that data with pre-season futures odds reveals which teams the market is pricing based on current rosters alone versus which teams the market is accounting for potential improvement. The gap between those two perspectives is where value hides.
Trade Deadline and Free Agency: When Cap Moves Shift Lines
The trade deadline — typically in early March — is the single most volatile moment for NHL futures prices outside of the playoffs themselves. Contenders acquire reinforcements; pretenders sell off assets. A single blockbuster deal can move a team’s Stanley Cup odds by several points within hours.

The cap is the engine behind every deadline deal. A contender adding a rental player — someone whose contract expires at season’s end — absorbs the remaining cap hit for a few months without any long-term commitment. A seller takes on a longer contract in return for draft picks or prospects, clearing immediate cap space while investing in future value. Understanding which teams are buyers and which are sellers, and what cap flexibility each has to execute trades, gives you a window into which prices are about to move.
Free agency in July produces a similar reshuffling but on a larger scale. The first day of free agency sees dozens of signings, each reshaping the rosters and cap structures of the teams involved. Futures markets are open during this period, and bookmakers are slow to reprice — especially for mid-tier teams that make several smaller moves rather than one headline signing. If you track the cumulative impact of a team’s free-agency activity before the bookmaker adjusts the line, the window for value can stay open for days.
Using Cap Data to Inform Season-Long Bets
My pre-season routine starts with a cap audit. For each of the 32 NHL teams, I record the current cap hit, the projected cap space for the coming season, the number of key players entering contract years, and whether the team has significant contracts expiring that create future flexibility. That audit feeds directly into my season win total projections.

Teams with multiple core players entering the final year of their contracts present a specific dynamic. Those players are motivated to perform — their next deal depends on it — which can inflate early-season results. But as the trade deadline approaches, if the team is not competing for a playoff spot, those same players may be traded, weakening the roster mid-season. A win total over that looked attractive in October can become a losing bet by March if the roster is dismantled at the deadline.
Conversely, teams that locked up their core on long-term deals at below-market rates — a common outcome when players sign extensions during the lower-cap era — carry structural advantages that compound season after season. Their cap-adjusted roster quality exceeds what the raw spending figure suggests, and their futures prices often do not fully account for that efficiency.
The salary cap is not glamorous analysis. There are no highlight-reel goals in a cap spreadsheet. But it is the single most underused data source in NHL betting, and the bettors who integrate it into their process gain a forward-looking perspective that pure on-ice metrics cannot provide. The ice tells you how good a team is today. The cap tells you how good a team can be tomorrow.
How does the NHL salary cap affect betting markets?
The salary cap determines which teams can add talent and which are locked into their current roster. Teams with significant cap space have optionality to improve through trades and free-agent signings, which means their futures prices carry embedded upside. Teams at or above the cap cannot add players without shedding salary, limiting their ability to respond to injuries or underperformance. Tracking cap data helps identify mispriced futures bets.
Does the trade deadline create betting value?
Yes. The trade deadline reshuffles rosters across the league, and futures prices do not always adjust immediately to reflect the full impact of deadline deals. Contenders who add key pieces may see their Cup odds shorten rapidly, but the initial move often underprices the improvement. Sellers who lose key players see their season win total projections drop. Acting in the window between the trade announcement and the full market repricing captures value.
Created by the ”NHL Hockey Bets” editorial team.